An updated tracker, focused on the 2027 Boston Marathon cutoff time, is now live.

The BAA announced the cutoff time for 2026 would be 4:34. Here's a reflection on their announcement, along with my latest prediction and my original prediction.
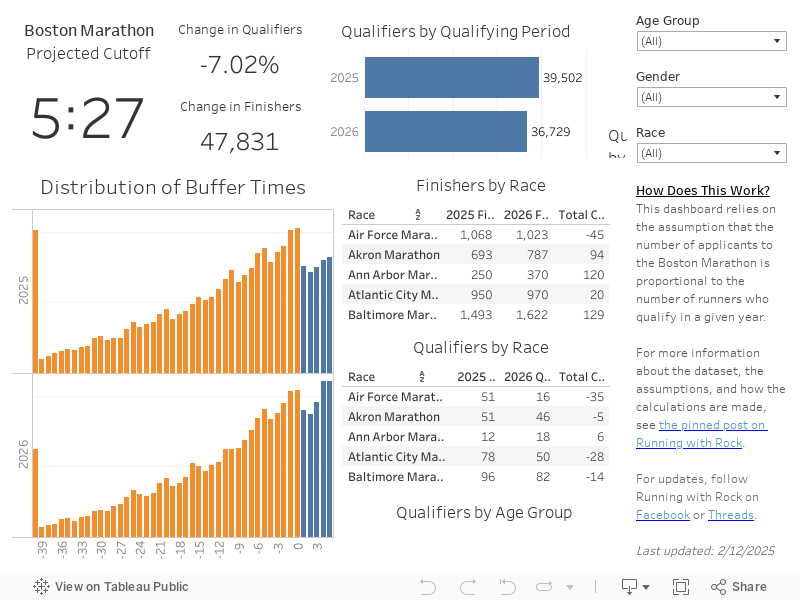
The Tableau dashboard below collects data from marathons, tracks the number of finishers who meet their Boston qualifying time, and projects an estimated cutoff time for the 2026 Boston Marathon.
It will be updated regularly throughout the year, through the registration period in September 2025. For more details on the data, the assumptions, and other factors, scroll down below the dashboard. I’ll follow up with a more complete prediction towards the end of the qualifying period. Follow me on Threads for the latest updates.
Want to Stay Up to Date with the Latest Data?
I will continue to update this dashboard throughout the qualifying period as additional races take place.
About once a month, I will write up an analysis of the recent races and what effect they’ve had on the projected cutoff time. Use the form to subscribe to my weekly newsletter, and I’ll let you know when those are published.
More frequently, I’ll just be adding data to the dashboard. I will update the text in the dashboard with the date of the latest update, and I’ll also post something on Threads. Follow me there if you want to be the first to know when new data is added.
What Data Is the Dashboard Built On?
For this dashboard, I’ve collected the results of marathons with 200 or more finishers in the United States and Canada. I’ve also included the results of London and Berlin, because those are part of the Abbott World Marathon Majors.
Based on its date, each race is classified as being in the 2025 and/or 2026 qualifying period. There will be a few races in September 2025 that fall into both qualifying periods.
Although I have the full dataset for the 2025 qualifying period, I’ve excluded the races that haven’t yet been run in the 2026 qualifying period. As the results become available for the 2026 qualifying period, I’ll update the dataset and include results for both periods.
There are some races that have zero finishers in one of the qualifying periods. If that race appears in the dataset, that means the race did not take place in that qualifying period – either because it was discontinued, it is new, or it was temporarily cancelled due to extenuating circumstances.
The dataset includes a finish time, age group, and gender for each runner. For the 2025 qualifying period, the old (2020) Boston qualifying times were applied. For the 2026 qualifying period, the new Boston qualifying times were applied. Each runner is identified as a qualifier or a non-qualifier and their individual buffer time is calculated.
The runners age when they ran their marathon is used to determine the appropriate qualifying time. It’s possible they age up before Boston, so the actual number of qualifiers is higher than the calculated number. But, we can assume that this difference is similar from year to year and that the difference washes out in the aggregate.
The data comes from a variety of sources, including Athlinks, Marathon Guide, and individual race websites. I have not yet done so, but I will be uploading the dataset to Kaggle later in the season.
What Assumptions Are the Dashboard Based On?
This dashboard is based on several assumptions. These assumptions were tested last year when I attempted to predict the cutoff time for the 2025 Boston Marathon, and they held up fairly well. They are not perfect – but they provide a good starting point for an analysis.
The Boston Marathon cutoff time is based on three things: a) the total number of applicants, b) the number of accepted applicants, and c) the distribution of applicants’ finish times.
The biggest variable is the total number of qualified applicants. There are a lot of factors that go into this, and it’s impossible to fully account for all of them. But the core assumption that I’m starting from is that the number of applicants is directly related to the number of runners who meet their qualifying times.
Not every runner who qualifies for Boston will apply. But the percentage of runners who do apply should be fairly stable. Publicly available results allow us to track how many runners qualify. We can then calculate how that number changes. Finally, we can apply that change to the number of applicants from 2025 to project the number of applicants for 2026.
More complex modeling would take into account the runner’s gender and age, the race at which they qualified, and their individual buffer. While I will attempt to explore some of these things later in the qualifying period, that’s better left for a thorough analysis. For the purposes of this dashboard, it’s more effective to rely on a single core assumption.
The next variable is the number of accepted applicants. We can’t know exactly how many runners the Boston Athletic Association will accept. However, this has been between 22,000 and 24,000 in recent years. There is no indication the field size will increase significantly, and therefore it’s unlikely the number of accepted applicants will grow beyond 24,000.
Therefore, I’m using that as the second assumption.
The third variable is the distribution of the actual qualifying times, which determines how many applicants need to be rejected to balance the field. Based on the data released by the BAA when it announced the 2025 qualifying field, I’m assuming this to be approximately 1,800 runners per minute.
With these assumptions – and the underlying data of results – it’s possible to make a simple prediction of what the likely cutoff time will be.
An Example of the Math Underlying the Dashboard
Here’s a simple example of how these assumptions work in practice.
Let’s say that the number of runners who qualified at this point in the year last year was 35,000 and the number who have qualified so far this year is 31,500.
35,000 – 31,500 = 3,500.
That 3,500 decrease in qualifiers is equivalent to 10%.
There were 36,393 qualified applicants last year. If this number declines by 10%, there would be 32,754 applicants this year.
To get to a field of 24,000 accepted runners, we would need to exclude 8,754 runners.
If there are 1,800 runners in each minute beneath the qualifying time, we divide 8,754 by 1,800 and get 4.86 minutes – or 4:52.
Can I Play With the Data Directly?
The individual results used for this dashboard is a large, raw dataset. The dashboard is designed to make it easier for your average runner to understand.
But if you’re a data professional, you might be interested in doing your own analysis of this data – either to make your own Boston cutoff prediction or for some other purpose. I’ve published the full dataset, and you can read more about that here.
The dataset includes individual results for runners at races across North America, plus a handful of international races, between 9/1/2023 and 9/12/2025. I will continue to update the dataset, along with the tracker, each week as new results become available.
You can download the dataset as a set of csv files to work on locally. Or you can create notebooks on Kaggle to work with it in the cloud.
Updates and Analyses
Here are links to updates and analyses that I’ve posted throughout the qualifying period.
- 12/2024 – First Look at the 2026 Boston Marathon Cutoff Time
- 02/2025 – Detailed Update on the Boston Cutoff from December to January
- 04/2025 – March Update on the 2026 Boston Marathon Cutoff Time
- 04/2025 – What Do the Results of the 2025 Boston Marathon Mean for the 2026 Cutoff?
- 05/2025 – May Update on the 2026 Boston Marathon Cutoff Time
- 05/2025 – How Accurate Were Past Predictions?
- 08/2025 – Use Conversion Rate Data to Predict the Number of Applicants
- 09/2025 – Final Prediction for the 2026 Cutoff Time
- 09/2025 – Applicant Announcement and Revised Prediction
- 09/2025 – Cutoff Time Announcement and Reflection
Future Enhancements and Further Analysis
This dashboard is a starting point, but I plan to make some improvements over the next few months to improve its ability to project and predict the Boston Marathon cutoff time.
First, you can filter out individual races. However, I plan to add some additional international races – especially big European races – and include broader filters for types of races.
Second, I’m currently basing my calculations off the age of a runner on the date of their marathon. It’s impossible to know for sure who does or doesn’t age up before Boston. But, I can identify some people who will age up and apply their new qualifying times. Once I work that out, I’ll update the calculations in the underlying dataset.
Third, the original dataset included all finishers – irrespective of how many qualifying times an individual runner achieved. Starting in early May, I updated the tracker to group results by individual (to the extent that it’s possible), and you can now make calculations based on an individual’s best time. You can read more about this in the May update.
Fourth, the percentage of runners who actually apply to Boston varies according to the depth of their cutoff time. Runners that are 5 to 10 minutes beneath their qualifying time are more likely to apply than runners who are 20+ minutes below. I may modify the assumptions to account for this.
This is really, really neat.
It’s possible I missed this, but does this analysis account for the adjusted cutoff times that were announced for the 2026 marathon? For instance, a 5:33 buffer for 2026 would be the equivalent of a 10:33 buffer for 2025. That it’d have been 10:33 is totally possible given the growing popularity and improved times, but I just wanted to be sure.
Yes, the calculations underlying the dashboard apply the older qualifying times to runners in the 2025 qualifying period and the newer qualifying times to runners in the 2026 qualifying period.
Note also that these new times are not exactly equivalent to an extra 5 minutes of cutoff. The qualifying times changed for runners under 60 – but runners 60+ have the same qualifying times as last year. And they make up a small but significant portion of the field.
To give you a sense of the impact of these new times, the new times put the total number of runners who qualified to date at about 6.5% lower than last year. If the old qualifying times were applied across the board, that number would instead be up by about 10%.
This fantastic and very helpful. Thank you!
I’m having trouble following. Are you predicting the new cutoff, for example, for 40-44 will be 5:32 below the new bq of 3:05, making it 2:59.54? Thats FAST.
Also, your cutoff prediction changes if I select certain results of races, etc but that makes no sense. The cutoff time likely won’t be based on where you ran (although I wouldn’t disapprove). Thanks! I think it could be a cool tool if I can figure out exactly what it’s saying.
Short answer: Yes. The X:XX projected cut off is how far under the new qualifying time you would need to be.
The filtering is a little funky, and I’m going to refine how that works. But the idea is that you may want to exclude specific races from the dataset to see how that could influence the eventual cutoff time. That’s because some races are more or less likely to actually produce applicants – and removing them from the dataset shows you what kind of influence they have.
Question on this: “If there are 1,800 runners in each minute beneath the qualifying time, we divide 8,754 by 1,800 and get 4.86 minutes – or 4:52.”
Are you saying that the calculation assumes some type of even distribution of runners (1,800)? I would think (?) that for every minute below qualifying there would be progressively less qualifiers; or vice versa, more qualifiers closer to the qualifying time.
Just curious how the 1,800 runners/minutes is determined.
The 1,800 comes from the data released last year by BAA – the number of applicants who were rejected and accepted in each time bucket. From 0-6:51 and 6:51-10 minutes, it was consistently around 1,800/min, and it didn’t start to drop off until 10-20.
ah got it, thanks!
now that this year’s 2026 projected cutoff is ~10 min under the previous 2025 qualifying times, does that dropoff @ -10-20 min come into play? or immaterial?
I find it hard to believe Chicago Marathon increased finishers by a lot, but LOST over 2000 BQs. That makes no sense. I think you should scrape the data again. I tried but my scraper was having issues. I may do it manually.
I’ll double check the results, but it’s likely due to the Age Group World Championships.
That was at Chicago in 2023, adding about 2,000 finishers who were very likely to BQ. That moved to Sydney in 2024, and they were replaced at Chicago by regular runners with a more typical distribution of times.
It was also warm this year at Chicago. This would have less of an impact than the Age Group Champs, but could also push down qualification rates a little.
So, I thought about that. But that’s a nearly 30% swing for an 8% increase in finishers. Still don’t make sense. And it really wasn’t that warm this year. I ran a sub-4 at Chicago this year, first time ever. Last year was warmer.
If you verify the data is good, then I would check Excel or whatever database you are using to make sure the times didn’t become strings. Also, the data you scrape doesn’t have BQ times inherent within it. You have to do a calculation somewhere. You can do it in Excel to manipulate in Tableau. Or you have to use a Tableau data blend or do a join. I prefer the manipulation in Excel as I’ve found the blend or join results in errors. But something doesn’t feel right.
In the analysis, I was going to do it from the “supply” end. I’m grabbing the results from all the majors. Then, putting the results into these buckets: 0-4:59, 5:00-7:59, and 8-plus. Why? Because, there has never been a buffer greater than 8 in the history of BAA buffers. Therefore, anything greater than 8 would be a “shoo-in.” My assumption if that number was near 24k, then what’s left is subject to the buffer calculation. Right now, you are showing 16k at the 10+ level. I’m guessing if you circle the time down to 8, you will approach 20k possible shoo-in applicants. If true, that’s a big number, WITHOUT the spring majors. But that’s my way at looking at the data.
The race had 2000 of the fastest people in the world that are likely to BQ… The next year they did not. The year before was textbook running conditions, the next year was not.
I can see why
thanks for the analysis
I have a 6:32 cushion on my 2026 qualifying time and felt pretty comfortable about it until reading your analysis
My only comment is that it really is hard to qualify for Boston and I find it hard to believe that the cutoff could still exceed 5 minutes even with the new times, but I guess the numbers so far seem to show that.
Yeah, I don’t really understand the math here. I get the feeling it’s probably right. But I just don’t understand how, ignoring BQ, and just saying “time to get in”, the number for under 34 went from “somewhere in the 2:54 range” to “somewhere in the 2:48/2:49 range”
Like what the fuck, is there going to be like double the people applying? How can there be such a drastic change in one year!
What about the Houston Chevron Marathon that happened this last weekend (1/19)? I don’t see it in the results and it is a pretty large marathon
The tracker should be updated later today with the results from Houston and several other marathons from this weekend. There’s a manual component to collecting and incorporating the results – but I typically try to update things within a week, and within a couple days for big races.
This is really cool (albeit a bit discouraging with my 4:09 buffer).
One question you mention in the write-up that there 36,393 qualified applicants for 2025 and the dashboard lists 38,494 under “qualifiers by qualifying period”. So it safe to assume that the delta is how many qualified runners chose not to apply (so roughly an application rate of 94.5% of people meeting the standard)?
Yes, the total number of qualifiers will be greater than the actual number of applicants – because not every qualifier actually applies.
Note that the 36k applicants is for the entire year. The number of qualifiers in the dashboard is based on races to date (and the equivalent time period last year). By the end of the qualifying period, there will likely be closer to 50-60k total qualifiers.
If I had a 4:09 buffer, I’d be nervous, too. It’s definitely possible that things moderate over the next few months, and a ~4:00 buffer is possible. But it’s not a likely outcome.
I don’t have an issue qualifying for Boston. I was disappointed trying to use a qualifying time for NYC in 2025 and 13 minutes is a lot. I Was 8 1/2 below and thought it woudn’t be an issue… I’ve done NYC twice before but it’s harder to get into now compared to 2008.
Would you consider adding the Mobile (AL) Marathon to your dataset? Selfishly I ran it and there were quite a few BQs so I am curious to see it added!
Hi Tyler. I usually limit the dataset to races with >200 finishers – because it would be a lot of effort to track the many smaller races, and they make up such a tiny percentage of the overall pool that it doesn’t impact the final outcome much.
But, since you asked … I’ll be adding the Mobile Marathon when I upload the updated dataset tomorrow.
And congrats!
Thanks for adding it into the mix! Appreciate your analysis and keep up the good work.
Hey Brian
Thanks so much for doing all this hard work! I am now checking this data obsessively until my Boston application in September. I currently have a 6:30 buffer so fingers crossed nothing terrible happens in the spring. Best of luck for your majors journey. I’m trying too, and have been accepted to one so far (Berlin 2025).
Take care!
-Maurice
Thanks, and good luck! With a 6:30, you’re _probably_ safe … but I wouldn’t be confident saying it’s a definite until we get through the spring races.
And enjoy Berlin! I’ve heard great things about it. I’m focused on Boston and NYC next – and after that, I’ll work on the international races.
which Spring Races or around what time of the year are you referring to in order to start getting more confidence in the projection?
April is a big month, and Boston is a huge piece of that. London is as well.
Once those are done, the vast majority of races/finishers for this qualifying season will be done. While there are a couple other important races later (like Grandma’s), by the end of April enough of it is locked in that the outcome won’t change by much.
Thanks Brian! I’m basically applying for everything and seeing what sticks, while trying to be quick enough to get a BQ. Then ill be following your footsteps with a half qualifier for NYC – seems like the best way to go for that.
One thing I am curious about is how the differences in qualifiers in “time brackets” could adjust the cutoff? For example, in briefly looking at the data set the largest decreases in qualifiers appear to be in the faster brackets (beat qualifying time by greater than 10 minute) while the -9:59 to -5:00 is currently flat and the -4:59 to 0 has increased.
I’m in the same boat as others. I have a 4:14 buffer for the Male 60-64 age group and wondering if I should plan for another marathon or cross my fingers that its enough for signing up for Boston 2026.
This is very cool, thank you for the effort to track this! I’ll be returning as the spring moves along.
These numbers were referenced on BAA site related to 2025:
– 6,971 Qualifiers met their qualifying time by 20 minutes, 00 seconds or more.
– 11,199 Qualifiers met their qualifying time by between 10 minutes, 00 seconds and 19 minutes, 59 seconds.
– 5,873 Qualifiers met their qualifying time by between 06 minutes, 51 seconds and 9 minutes, 59 seconds.
Link: https://www.baa.org/field-qualifiers-notified-acceptance-129th-boston-marathon-presented-bank-america
Comparing the numbers from BAA site with what you are tracking may suggest a material number of BQs run by the same people in different races. For example, you had 12k 20:00+ BQs at this point last year, but in total only 7k entries were from the 20:00+ group. So either 5k+ really fast runners didn’t apply or the BQs are the same people. I’m thinking (hoping!) the latter. Is that something you are considering or de-duping in this analysis?
40 year old with a 6:10 buffer. I thought I was pretty safe until I read this analysis.
I know I can run a fall/winter marathon faster, the question is if I should do it before September to have a bigger buffer, or after September to get another Boston marathon under the belt (2027).
Damn, now I’m not sure what to do.
interested what the recommendations are here, as i’m in the same boat (40 yo w/ 6:16 buffer). i’ve heard that there are races that occur in September that qualify you for both 2026 AND 2027 because the qualifying periods have a small overlap. maybe that’s the route to take?
I never heard of that PK. There are the Last Chance BQ races in September I’ve seen. But I assumed that would only be the same year’s qualifying period. I’m in the similar boat to you guys. I’m just waiting on Boston 2025 results and hoping it isn’t that fast of a race!
There’s typically about a two week overlap of qualifying periods (in recent years).
For example, the qualifying period for 2026 started on 9/1/2024. The qualifying period for 2025 ended on 9/13/2024. Any races in that time period (basically 9/1/24, 9/7/24, or 9/8/24) would count as a qualifier for both.
This isn’t 100% guaranteed, though, because the dates of the qualifying period aren’t announced ahead of time. The last few years, it has worked out this way, but pre-COVID they didn’t overlap at all.
Brian thanks for the great work you’ve done here. Could you clarify for me what your thoughts are for the 60-64 age group? Do you think the buffer will need to be well over 6-7:00′ or higher, lower? Thanks for the help.
Dear Brian, many thanks for such useful data and insights. It has been mentioned a few times that Spring marathons will weigh significantly on the estimate, notably London and Boston. Although I follow the rationale for London, is Boston relevant ? Presumably once a runner has qualified and run it once, there is little probability he would be applying again the following year regardless of his performance ? From a personal standpoint, I have a 7:11 buffer in the 40-44 category and will be checking this page religiously as I can hardly see how I can improve this ! All the best, Guillaume (France)
Hi Guillaume. Good question – and I think the best way to think about it is that there are different groups or types of people that run Boston.
One group – likely including a lot of people like yourself who would travel a long way to Boston – see it as a bucket list item. Check the box once, no need to come back.
Another group – likely including a lot of local(ish) folks from the greater Boston area – see it as a very exciting local race … And want to run it as often as possible.
Last year, well over 10% of the finishers were from Massachusetts. Boston is, year after year, the #1 race used to qualify for Boston (per the BAA’s statements). And the number of streakers (10+ years) is slowly but steadily increasing each year.
There’s some nuance to it – and a more complex model could take into account some additional factors – but one way or the other, the results from Boston is definitely a big factor.
Either way, I’d feel pretty comfortable with a 7:11 buffer. I doubt the cutoff will get that high. Good luck!
Hey Brian,
Along those lines, I totally get why Boston is such a big qualifier, but is London really a big factor? Big race, but it is on another continent..
If 10% of BQs come from the Boston race itself, do you have that stat for London too? Just curious.
Cheers,
Maurice
Just to clarify, 10% of the field is from the Boston area – not necessarily the Boston Marathon. Altho Boston is typically #1, and it’s likely close to or just under 10%.
A smaller share of London’s runners will apply, but London is still one of the top sources of runners – usually #3.
Last year, BAA actually released exact numbers. 2,600 were from Chicago, 1,800 from Boston (a down year for the race due to the warm weather), London came in third with 1,100, and Berlin came in fourth with 800.
A more nuanced model could apply weights to each race (Joe Drake did some work on this last year, but I don’t think he was ultimately happy with the outcome of that experiment) or use additional data about the runners to project the likelihood of applying (nationality, buffer, qualifying race, age, etc). But absent that (and I might use data from the last two years to work on a more nuanced model for next year), London is too big to ignore.
Wow, ok, cool. I had no idea so many qualifiers came from foreign races like London and Berlin. Although they have huge fields and are majors themselves so makes sense from that perspective.
Cristal clear and thanks for clarifying. I had no idea how big a share local runners represented ! All the best, Guillaume
Yes Guillaume, and not just Boston runners either. I have several friends in Kentucky(1000+ km away) and they try and go every year too. A classic race attracts a lot of repeat runners!
Why don’t the men just qualify as non binary?
I don’t understand the filter that breaks it down by age group/gender. Right now it listed the cutoff time to be 5:34. I believe that the overall cutoff time is the same for every group. However, when I plug my AG/gender in in the filter, (67 y.o. male) it said my cutoff time was 7:39. Since I got my BQ with a time 7:08 below the standard that would be a bit concerning.
Hi Jim. The cutoff time is enforced the same throughout the field, so pay attention to the projected time when it’s unfiltered. At BQ-7:08, you’re probably safe
The filters are more for exploring the data to understand how things are changing for specific age groups and how much influence a particular race has on the results.
This is awesome keep up the great work! Thanks for putting it together. Is there a reason not to include the Tokyo Marathon?
I’m still analyzing the results from Tokyo, and I’ll share a few insights this weekend (now that the official results with ages have been released).
But I chose not to incorporate them directly into the tracker, because the share of runners at Tokyo applying to Boston is very low. For the most part, I only include American and Canadian races, with the exceptions being Berlin and London. I only include them because they supply a large number of applicants to Boston.
Although Tokyo is large, very few runners from Tokyo actually apply to run Boston. The majority of the field is Japanese, and Japan doesn’t even crack the top ten in the countries represented at Boston. In 2024, there were 154 participants from Japan. This year’s entry list has 195.
Tokyo Runner here applying to Boston 26
Thanks for doing this! How accurate do you predict this will be? Do you happen to have a confidence level? Did you do this for last year and got close to the actual buffer?
Hi Mark. I didn’t track the data throughout the year last year, but I did do a similar analysis at the end of the summer.
At the end of August, my initial prediction was 7:03. Once the final races were done in September, I predicted the number of applicants would be 36,248 (it was 36,406), and that the cutoff time would likely be between 6:30 and 7:30. So in a sense I was spot on – although I also got a little lucky. My prediction was based on 22,000 accepted applicants; they accepted 24,000. If they hadn’t upped the field size, the actual cutoff time would have been closer to 7:45-8:00, and my prediction would have been a little low.
Say all that to say … the methodology checks out. However, there is still a level of uncertainty – and that goes down over time.
At this point, I also haven’t de-duplicated the results to account for runners with more than one race result. By the end of April, the majority of the results will be in and I’ll adjust the tracker to reflect de-duplicated results. At that point, most of the uncertainty will be gone.
My head may be thinking about this wrong – but wouldn’t removing the de-duplicated folks reduce the buffer time?
Yes, no, maybe so …
The methodology is applied the same to both the 2025 and 2026 qualifying periods. De-duplicating will lower the number of qualifiers – but it will do so in both qualifying periods.
So unless something is different between the two years (more or less people running multiple races), you’d expect that decline to be consistent in both qualifying periods. And the key metric is the net difference in qualifiers from one period to the next, so if they are both reduced by the same amount there shouldn’t be any change.
But it does eliminate some uncertainty – by reducing the possibility that there _is_ a difference in the number of people who qualified at multiple races.
So it turns out the 2025 Publix Atlanta Marathon course was not certified (not by USATF or any other organization). The BAA website unequivocally says this is a requirement: “Only a certified full marathon distance will be accepted for qualifying.” The course itself was also short, but I suppose that’s actually moot.
If I’m reading your tracker correctly, it looks like only 85 people ran a BQ in Atlanta this year. Probably not a significant impact on the overall projection. But this has gotten me wondering how BAA verifies which races are certified. Atlanta is a major city and they’ve always had their course certified in the past. Wouldn’t be unreasonable for BAA to assume they had everything in order. Especially since Atlanta hosted the HM Champs this year (which is ironically why the course was altered from the year before and they failed to have the full course certified).
Penny for your thoughts?
My thoughts…? That’s wild.
The new half marathon course was measured and certified in February, so I don’t know why they didn’t also do the full marathon. In the scheme of things, it shouldn’t have a huge impact on the cutoff time (85 people qualified last year, 80 ran qualifying times this year), but if I was an athlete who ran a qualifying time I’d be pissed off.
Race directors have to report their results to the BAA, and I’m assuming that part of that report includes information about the course certification. They also go through a verification period to check qualifying times, so that would be another opportunity for them to verify a course was certified. There are likely only a few hundred races with relevant results.
Regardless, thanks for pointing that out. I hadn’t heard about the issue with the course.
Following up on this …
I reached out to Atlanta Track Club, and the race director indicated that the course was properly measured and the certification is in process. Judging from the dates on the half marathon course’s certification, this was last minute. I’m guessing they expedited the half marathon course because it was the USATF champs, but the marathon course was less urgent.
So in the long run, it should all get sorted out (well before the Boston Marathon registration period).
Just a few days later: https://www.atlantatrackclub.org/news/2025-publix-atlanta-marathon-course-update
Yup. Saw that last night. Disappointing, for sure …
I’ll be removing this year’s Atlanta results from the tracker when I make next week’s update.
Brain, you rock!
Seriously, what a wee gem of a tool you’ve got here. Someone linked to it in the middle of the night, and I spent the better part of the next hour reading through some of your observations.
I totally thought that the change in BQ times would mean that this year’s buffer would be a lot less, but it’s looking more likely that that won’t be the case. I think I may struggle to run 5mins faster than my BQ age time of 3:20, but that BQ time for 2027 jumps 10mins, and that’s a lot less daunting!
Cheers again for all your hard work,
Willie (New Zealand)
is Revel White Mountains missing from the list?
It’s not in there now. The way the tracker works is that it pulls in data from last year’s races when this year’s version of the event happens, so it’s always an apples to apples comparison of this year to date vs last year to date.
So once the 2025 REVEL White Mountains takes place in May, the results for year’s race and last year’s race will show up.
thank you!
This is very cool! Though I’m not sure how to read the graph. I understand the projected cutoff is the buffer for my category (I filtered for women 45-49 – 4:28 overall and 3:34 for CIM which I’m considering running). But on the graph are the figures represented in blue folks who didn’t qualify at all? Or weren’t within the buffer? Thanks so much – I’m eager to see this evolve as more data comes in!
Hi Kim, in case Brian doesn’t get to this. My understanding is that the only number that matters for any of us is the magic “Projected cutoff”. Currently at 5:31. That is what we will all need to beat, regardless of age or gender when it comes to registering for Boston 2026. The filters just show comparisons with other groups of runners.
Not sure if that helps!
Hi Kim. Although the filters can effect the projection in the visual, that’s really just for exploring how different things impact it. It doesn’t vary by age or gender, so the main projection (currently 5:31) would apply evenly across the entire field.
In the chart titled, “Distribution of Buffer Times,” the blue bars represent folks who just missed the qualifying time. All of the orange bars are people who met their qualifying times. Although you’ve now given me a good idea to maybe add a third color to represent the people who met the qualifying time but wouldn’t meet the projected cutoff time.
thank you so much for the clarification and explanation! eager to see how this data evolves for future years as well.
Thank you so much for pulling all the data together. Although I must admit that I have my fingers, arms, legs and toes crossed that your data is flawed; my time was 2 mins better than the 2025 cutoff but with the predicted new cutoff won’t have been enough for 2026. Gutted.
So just to keep this straight, if I’m a 30y male and just got a 2:53:00 and the qualification time is 2:55:00 – 5:09, I’d miss the cutoff? If true, this is devastating, because I think 2:53:00 is the best I can do. Last year, everyone who had 2:53:09 and below got in… I ran the Athens Ohio marathon this last Sunday.
Yes, if you’re in the under 35 category you’ll likely need at least a 2:50 to get in. There are just way more people running this year, so the new qualifying times didn’t really cut down the qualifying field much.
Even if you don’t make the cut, be proud of your time, that’s great! And if you can run a 2:53, you can run a 2:50 (and probably a 2:45). Keep training and add a few more miles. Maybe it takes another year or two, but the great thing about running is if you keep training, you keep improving. And if all else fails, 35 is right around the corner.
What about this:
We will use a 3:30:00 qualifying time:
2025 Boston, you needed a 00:6:51 buffer to qualify and that makes the 3:30:00 now 3:23:09 or faster.
2026 Boston, the BAA have moved the qualifying time back 5 minuets and the 3:30:00 now becomes. 3:25:00.
Doesn’t the new 00:05:00 faster time factor into the new buffer needed for 2026?
I was thinking that even if you take the 00:06:51 2025 buffer and minus the new 00:05:00 cutoff, that still leaves you with 00:01:51 buffer for 2026.
If nothing else changed, that would be about right (ignoring for the moment the fact that the qualifying times didn’t change for runners 60+, who make up ~10% of the field).
But there is a major change. The number of people running marathons has increased a ton. Those extra runners offset a lot of the impact of the new qualifying.
In some cases, races had more qualifiers this year than last year – despite the qualifying times dropping five minutes for most runners.
any chance that boston increases the field size and accommodates more people under the BQ standard? considering every marathon is increasing field size, is boston next? and considering they just lowered the time to make it more difficult, maybe they want to reward more runners who hit their time goal?
– somebody who ran 1:30 under the BQ time, willing this into existence.
Possible, but unlikely.
For years, it’s been pretty stable at a field size of around 30,000 registrants. The biggest outlier was 2014 – when they bumped things up to over 35,000. But that was a one time thing for the year following the bombing.
Since then, 2020 was supposed to have 31,500, but that race was cancelled due to COVID. This year, they initially announced a field of 30,000, but they seem to have accepted 32,000 based on the number of bibs issued (and the number of finishers is ~2,000 higher than other recent years). That allowed them to bump the number of accepted qualifiers from 22,000 to 24,000.
Does it get bigger from there? Probably not. Due to the logistics and all of the small towns involved, the consensus has always been that there wasn’t much room for growth. It definitely won’t ever be 40-50k like the bigger races. Maybe they grow incrementally, to 33k or 34k. But I think the best we can realistically hope for is that 32k is the new standard – and that they don’t bump back down to 30k.
Super interesting data! This may be an impossible question to answer but how big of an effect time wise could London have on the results given the size of the race? Boston obviously caused a huge swing, but could London swing it a minute in either direction depending on the type of day they have?
London is a bigger race, but it produces fewer qualifiers than Boston. So it’s important – but even a drastic change at London wouldn’t swing things that much.
But for context … next weekend’s races produced ~10,500 qualifiers last year (~9,000 from London, 1,500 from other races). Let’s say London has a bad day, and that number drops to 7,500 to 8,000. Possible if there’s warm weather at London, and the other two big races (Eugene / Glass City) don’t do much. That big of a swing would only bring things back down to ~5:45-6:00.
The weather looks a little warm (low to mid 60’s when the first waves are finishing), but it doesn’t look bad enough to be catastrophic. On the flip side, London likely won’t grow by enough to offset the new qualifying times. So some decline is pretty much baked in. My guess is there are ~8,500 to 9,000 total qualifiers next weekend, and that would leave the projection well north of 6:00.
Super helpful as always – look forward to the updates and de-duplicate results. Not feeling so great about my 7:10 buffer anymore!
Well, this is a huge kick in the balls, Brian. Do you think there is any chance this will go down over the next 5 months?
Boston 2025 jumped it up 75 seconds?!! Ugh
OK, I just saw your other post on the effects of Boston 2025 and I feel a little less depressed. There is still hope. I’ll take a deep breath and wait. But this is turning out to be a BRUTAL qualifying period. Boo! Thanks again for keeping us all posted on everything.
Okay, just signed up for revel white mountains (1 month after my -5:30 bq). This is your models fault 🙂 ! #feedbackloops
Hi Brian, look like the projected cutoff came back to sub 6’ levels. Is that because you added in London or by removing duplicates ? Or both ? Thank you
That was just the London results (plus the rest of this weekend). When I make the update to de-duplicate, you’ll know – it’ll be an option you can toggle on the dashboard to see unique finishers vs all finishes.
Hi, Great stuff here – Thank you ! Do you know if the “penalty” time is calculated for each group separately?
Does that mean – if I want to see my prediction, I filter – Male, 40-45? = 4:39?
Thank you again
I think the same cutoff apply across all age categories to make the selection process transparent and equitable. Everyone competes within their own category, but the margin by which you beat your qualifying time determines entry the same way across all genders and age groups.
Great tool and incredible insight. I know it was mentioned throughout, but is there a page that shows your predictions for years beyond 2025 to show how well this tool has been? such as your prediction for 24 versus the cut off, 23, etc ? I do not know how long you have been tracking.
Thank you
I have some questions about this. For the Salt Lake City Marathon for example, It says that 20 men qualified who were under 34 years old in 2025, but when I go to the Salt lake City marathon results for 2025 I only count 11 male qualifiers under 34.
Thanks for catching that.
There were some results from Athlinks that were DNF’s, and the reported finish times were for the last split. So there were some people who looked like they BQ’d – but weren’t actually finishers.
I’ve scrubbed those bad results from my data, and the dashboard will reflect those changes next week when I make the next update.
Hi Brian – really appreciate the work you’ve put into this predictor. I’m 37 and currently have a 2:33 buffer (Finished marathon at 2:57:27) — looking at the data – what are the chances i actually get in? It would have to take a miracle, correct?
Recognizing my 3:30 buffer just isn’t going to cut it, I’m looking to give it another shot late summer. Any guidance on when the qualifying window will close?
Love how much time and energy you put into all this! I know you’ve mentioned how Mt. Charleston has a major increase in BQers. To give you a little background as to most likely why: Big Bear was cancelled (I heard they cancelled it at 2am the morning of the race) back in October and all entrants were given the option for a free Revel race. Mt. Charleston had like 600-800 more runners this year than last and chatting with runners, there were quite a few who were running Charleston with a bib because of that.
Makes sense about the Mt. Charleston increase — and yup, can confirm that Big Bear was canceled due to weather and bad road conditions at 2:24 a.m. the morning of the race in November, via email. (Right about the time I was heading to the buses!) Big disappointment but while I was unable to do a makeup at Mt. Charleston I was lucky enough to BQ -7:09 at the Carlsbad Marathon in January — hoping Brian’s latest predictions in his awesome work here hold up!
Por favor podrías comentar porque no está la maraton de Tokyo como parte de las estadisticas?
Hi Sebastian. The main reason the data isn’t incorporated into the tracker directly is that relatively few runners from Tokyo end up running Boston.
If you were to just look at the results from countries most likely to apply to Boston, then the number of qualifiers at Tokyo dropped a few hundred from last year to this year – the impact of which could be ~5-10 seconds on the cutoff.
You can more about the Tokyo results here: https://runningwithrock.com/tokyo-boston-qualifiers/
Can you clarify your “distribution of the actual qualifying times” assumption, which you set to 1,800 per minute? Do you mean the distribution of applicants? With the new lower BQ standards, is it possible that the distribution of qualifiers is clustered closer to the BQ threshold?
Yes, more precisely that 1,800 represents the distribution of the applicants according to their buffers. That’s based on the data released last year – and it was consistent for runners with buffers from 0 to 10 minutes. It starts to go down beyond 10 minutes – partially because the number of qualifiers is lower but partially because fewer of them apply.
As for the question of whether the distribution of qualifiers has changed – and whether more of them have times near the new BQ threshold – you can see that data in the tracker. The “Distribution of Buffer Times” graph shows the number of runners in each qualifying period in 1 minute bands. It’s pretty consistent down to 10-15 minutes, and then the number this year starts to get a little lower.
In other words, the number of runners with 0-15 minute buffers is pretty consistent, despite the new qualifying times.
Hi Brian — approximately what % of BQ-eligible races have been factored into your dataset?? I know some big races are coming up (e.g., San Francisco), but I doubt that that one, amidst other races that happen during hotter summer weather, will produce that many BQers. Trying to get a better understanding of how much more change we can expect in your model prior to September.
About 90% of the potential results are in the past at this point. You’re right that most of the remaining large races aren’t large qualifying events – between the heat and the hills, not many of these summer races are fast. Grandma’s and Ottawa are probably the two most notable qualifiers left.
But with so many results already behind us, the room for change moving forward is pretty small. It could get pushed up or down slightly, but I wouldn’t expect any significant changes.
Great and thank you!! I’m right on the cusp with a 6:04… it’s going to be a nail biter until then
Given the upcoming Grandma’s marathon what is the view toward impact of this race on the dataset?
It’s one of the last large, fast races remaining for the year. It’s unlikely to grow by much, and weather conditions last year were good, so there likely be fewer qualifiers this year than last year.
But … there are so many results already in the bank that it likely won’t change things by much. My guess is the projection ticks down slightly after Grandma’s, but not by too much.
Based on past BQ estimates… how close was your cutoff time tracker in previous years? How far off was the estimate when compared to the actual Boston cut off times in 2024 & 2023?
This predictor is such a cool tool, but I’m also really curious about how the same analysis when applied to previous years compares to what the actual cut off times were. Looking at those past results could either find something to make this more accurate for 2026 or just confirm the prediction method is already accurate.
Any chance you could give that a shot Brian? Thanks for putting all this together!
Are you asking whether or not his prediction/methodology was accurate in previous years? If so, his predictor last year using the same method was within 10-15 seconds of the actual 6:51 cutoff time, so I’d say it’s pretty accurate
Do you have know what the “end of registration period” might be for the year? How do they determine the close date?
There’s no hard and fast rule, and if you look back over the last 10-15 years there have been some changes and minor variations in the registration process.
But based on the last few years, registration will likely open the Monday following Labor Day, and the last weekend to run a qualifying race would be September 6-7. In years when Labor Day is late, there have been two September weekends in the qualifying period. But this year, Labor Day is early, so there’s likely just one.
When we get closer, they’ll announce the actual dates – probably in the next month or two.
I appreciate all the work that went into creating this, however, I’m not sure it’s accounting for the increased standards correctly. Let me explain.
In 2019, the cutoff time was 4:52.
In 2020, the standards got 5-minutes faster, and the cutoff time dropped to 1:39.
In 2024, the cutoff time was 5:29.
In 2025, the cutoff time was 6:51.
In 2026, the standards got 5-minutes faster, and you’re telling me that the cutoff time will remain virtually unchanged? Or put another way, the cutoff time will be ~12-minutes under the 2025 qualifying time? It’s never been anywhere close to that before.
For me, that doesn’t pass the sense check.
If the other factors stayed the same, and this year was a typical evolution in a slightly evolving field, then yes. Such a jump would be a drastic shock.
But the key factors that determine the cutoff are not the same. The last two years have seen a steep increase in the number of runners finishing marathons – and running qualifying times. The data in the tracker is based on actual results, from actual runners. And it’s a simple, observable fact that the number of finishers is up ~12% and the number of runners qualifying is only down ~6%. This trend did not exist in 2019-2020, and there is no parallel in recent history for this kind of growth in the field. And this will most likely lead to an applicant pool that is only slightly smaller than last year – and likely larger than it was in 2024.
It may be hard to believe at first, but when you examine the underlying logic and data … it absolutely passes the smell test.
Thank you for your hard work here!
How much did your tracker time change between this time last year and the application time in September please? (Or, moreover, how close was it this time last year). Currently have a buffer of 6 minutes and 11 seconds (with 2.48.49). So it’s ahead of the the predicted buffer currently, but don’t want to get too carried away!
Hi Ben. This is the first year I’ve tracked things in real time, so it’s impossible to say.
But at this point, the vast majority (~90% or more) of all results are complete. It could change slightly moving forward, but it’s incredibly unlikely that there will be any large swings – unless something catastrophic were to happen, like Grandma’s was cancelled altogether.
Thank you for this clarity Brian. So you think a 30 second swing either way is very unlikely?
Obviously I appreciate you can’t be certain and I won’t be holding you to it! Just want to gain as clear a view as possible. Thank you.
Well, today’s news will be interesting to see how it impacts your stats!
Was just curious what the projection would be if the time adjustments were applied during this qualifying period. So when I remove the races you listed here: https://runningwithrock.com/boston-downhill-marathons-affected/
…the projection jumps up to 5:55 to 5:39.
I know that removing the races isn’t the same as adding 5 or 10 minutes to everyone’s time. But would’ve expected to projection to actually go down and give some kind of approximation. I’m sure there’s an explanation that I’m struggling to reason out (or I’m doing something wrong) while coffee is kicking in.
Am I comparing apples to oranges?
I’m sure this has something to do with there being less BQers this year than last in those set of downhill races. But that doesn’t seem to feed into the rationale from the BAA to penalize/adjust those races.
Scratching my head here.
Something doesn’t make sense here — does the cutoff really get harder without the downhill marathons?
It is kind of an apples to oranges comparison. There are a couple factors at play, so just filtering out the races altogether will give you an unexpected outcome.
The short answer, if you’re interested in how much it’ll impact a future cutoff, is that the adjustments would have eliminated ~1,000 qualifiers from this year’s qualifying period (so far, since there are couple downhill races still to come). All told, it’s probably around 30 seconds, give or take.
But when you filtered out the downhill races and the projection jumped, that’s a sign that the current results from those marathons are pulling the projection down. If you just consider the REVEL races, Big Bear had the full marathon canceled this year (-742), Rockies is retired (-211), and White Mountains had fewer finishers (-208 qualifiers). Mt. Charleston was the only net increase (+227). Of the others, St. George had a net drop in qualifiers (-208) because the field size remained around the same and Mesa was down in qualifiers (-140).
Collectively, these races are pulling the projection down … so if you filter them out, it bounces the projection back up.
For a more detailed analysis of how many qualifiers the downhill rules would eliminate, check this out: https://medium.com/runners-life/analysis-of-the-impact-of-the-boston-marathons-new-downhill-index-43544096a5d3?sk=dfb0cefd63dc3c4f9ed036eaf5025b24
Hi Brian,
Thank you for your content — I really appreciate the insights you share.
When we remove only the Boston Marathon from the calculation, the cutoff time drops to 4:15. So I started wondering what percentage of Boston marathoners will apply again the following year, and how that might impact the final cutoff time.
Hey Mauricio,
I’m not Brian, but I’ve been thinking the same thing!
One of the big assumptions is that the percentage of qualified runners that apply from each race is roughly the same. Brian himself has acknowledged that this might not be perfectly true, and has mentioned the idea of weighting the different races, but hasn’t found a a strong motivation or a good way to do it yet. I think after looking at the data there is a strong argument for different weightings for small and large marathons.
My logic is to compare the average conversion rate (% of qualified runners that become Boston entrants) between
1. the whole population,
2. the known conversion rate for large races and
3. the inferred conversion rate for small races.
1. There were roughly 24k successful applicants to race in 2025, out of 63k qualified which is a 38% conversion rate of qualifiers to entrants on average.
2. However, we know which 5 races contributed the most runners to race in 2025 – Chicago, Boston, Berlin, London and Cal international, and they contributed around 7,000 runners. (Tried to include a link to the BAA but the comment keeps getting moderated for some reason…). Comparing this to the number of qualified runners from those races (34k for 2025) we see that runners in those big races have a ~20% conversion rate, so they must be applying for Boston at a MUCH lower rate than the average. I think we can safely lump NYC in the same category because we know that they had 4300 qualifiers last year but less boston entrants than california international (750 for a 17% conversion rate). In a way this is similar to Brians reasoning for excluding Tokyo from his analysis, but much less extreme.
3. On the flip side, if we exclude those 6 giant races we find 26,000 qualifiers for the 2025 race that must make up the remaining 16000 entrants. A 61% conversion rate, WAY higher. So runners in small races are more likely to apply for Boston. We also see a projected cutoff time of only 3:42 under, more in line with the historical trend (Tried to include a link but the comment keeps getting moderated…)
From this, I predict that the Boston qualify time will be more heavily influenced by small races than big races. In 2025 those big races were all very fast, essentially 5 minutes faster than 2024 yielding almost exactly the same number of qualifiers – 37.5k despite the 5 minute change in standard. But we have now established that these runners are less likely to end up at Boston. So I believe this is dragging Brians prediction down below 5 minutes under cutoff. Another way to look at it – If we assume the same conversion rate as 2025, we would expect the same number of entrants as 2025 – only 8000 Boston entrants from these 6 races (+1000 for New York), leaving 16000 openings for the remaining 22,000 qualifiers from smaller races, a more favorable situation than last year (16,000 openings for 26000 small race qualifiers).
My prediction is that the cutoff time will be somewhere in the middle – between the 5:34 (currently) with all races and the 3:42 excluding the large races. I’ll guess 4:05-4:45. Not a huge change, but meaningful for some and still far too close for comfort for me. But either way, excited to see how it turns out!
For anyone who wants to recreate this its pretty easy thanks to Brians awesome GUI – use the “all” checkbox to select all races or no races, and then you only have to select or deselect the 5-6 large races. I ran all my numbers with “Use fastest time” set to True.
Would love to get a reply from Brian 🙂
Hi Greg. Sorry about the moderation trap – WordPress flagged the previous comments because of the link, and I’ve been so busy the last week or two, I haven’t had a chance to pay any attention to these comments …
You’ve given me some food for thought. Doing some more complex modeling has been on my to do list, and I hope to get to it before the end of the summer. But for now, maybe I’ll just focus on the conversion rate question, because it’s a little eaiser to get a handle on.
I like the way you’re thinking, but here are a couple counter points.
If you’re comparing the number of qualifiers from the 2025 qualifying period to the number of accepted runners at the 2025 Boston Marathon, you should be comparing the number who made the cutoff (BQ-6:51). The dashboard won’t let you get that precise, but a good approximation is to eliminate the qualifiers with 0-5:00 buffers. When you do that, Boston, Chicago, and CIM all have 30-35% conversion rates and London and Berlin have 10-15% conversion rates. I think it’s perfectly fine to lump Boston, Chicago, and CIM (and probably some other big US races) together, but London and Berlin definitely belong in their own category (along with other big international races).
On the flip side, using the remaining qualifiers to infer a conversion rate from the remaining races is going to give you an inflated number. That’s because there are many qualifiers unaccounted for – those at other international races (which is a lot) and those at smaller US races (which is not a lot). So if you’re calculating just from the remaining qualifiers in the tracker, it’s going to make the conversion rate at those races look much higher. My guess is the conversion rate at regular US races is probably in the 30% (+/- 10%) range, and other international races is much lower (10% or less). Although I have looked specifically at results of downhill races, and they do convert at a rate of ~65%.
With the raw data, it’s possible to match up qualifiers from the qualifying period with results from the next Boston Marathon – and calculate an actual (estimated) conversion rate. Joe Drake did some work on this last year (https://joesgottarun.medium.com/a-deeper-dive-into-the-cutoff-time-for-the-2025-boston-marathon-7e1fd6da2818), but I think I’ll go back and run some numbers on that question this week.
No worries! I should’ve known the links would be a problem.
Thanks for taking the time to think about this! 🙂 And I have to say again – the dataset and the dashboard are both wonderful. So fun to see – thank you!
Ahhh – I didn’t realize there were so many international runners from other races. That makes so much sense! I kept thinking there had to be more people who ran those smaller us races for reasons other than Boston. So that part of my thinking is (mostly) nullified. Certainly not the 61% conversion I came up with, or the 65% you have for downhill races, but it might still be higher than the big races, or than Boston itself. Curious to see what you find and I will certainly be keeping an eye out! (I feel lazy for not having started working with the raw data itself, but there’s always a little startup barrier)
Good idea about excluding the 0-5 buffers, that will definitely make the estimated conversion rate better. And I see you are absolutely right about the difference between US and international big races. I zoomed in a bit, but not quite enough!! Good catch. Keeping that in mind it seems like the two races that were really fast are actually Boston and Berlin – Berlin I think is almost certainly bringing the time down a bit since we expect a low conversion rate, but likely not a ton since throwing it out entirely only bumps the time down to 5:00… Also potentially just cancels out London as an outlier on the opposite direction (showed a decrease in qualifiers).
Boston on the other hand… A LOT of what I observed seems to be coming from Boston itself being insanely fast in 2025. (which is what Mauricio was initially pointing out). I guess its hard to judge whether this would bias the prediction, or play in exactly how we would hope…. First pass thoughts – 46% increase in qualifiers… if that holds for entrants that would be an additional 840 re-entrants (1.46*1822 re entrants last year). working directly off the 1800 rejects per minute, that would be 28 seconds of additional buffer. Obviously this is going to be quite right, but that’s still a far cry from the 1:20 difference that excluding Boston has on the current prediction (actually 1:40 if we exclude Berlin first). I’m still willing to bet that the smaller races are a better estimate of what is happening globally because they average across variable weather conditions. Sticking with my ~4:20 prediction!
I feel like this sort of model will be particularly useful next year when we have two years of data and can actually take a look at how consistent the conversion percentage is for certain rages/groups of races from year to year!
Managed to call my shot on this one! 😀 admittedly within a large 4:05-4:45 range. Think we can chalk it up to luck. You more or less already ran the race by race conversion rate analysis and I don’t think it would explain the dip in the 10-20 minute buffer conversion anyway. What a mystery! Was thinking its right around the London qualify time? but that doesn’t matter for most people. Maybe a disproportionate number of 1 and done Boston runners ended up in that bucket because it was so fast? Even though many DO come back it still looks below average -Boston conversion rate at a consistent ~25% conversion rate (25% for 2025 and 28% for 2026) (vs 30-50 for most of NA according to your analysis). Anyway, Looking forward to your deeper analysis to come 🙂
p.s. I’m extra psyched because I made the cut by 5 seconds. Really wasn’t thinking it would come together this year. 😀
Hi Mauricio, the percent is fairly high – between 30 and 40% of qualifiers at Boston run again the next year. For some people, it’s definitely a one and done, bucket list kind of thing. But there are others who run it year over year.
Mauricio, I know I will. I have run Boston 10 times; this year was my 5th year in a row. I very much want to get to 10 years in a row. I am at 5:24, so I am of course quite concerned. If I was just 7 days older, I would be in the next age group and get *15* more minutes, meaning I would be one of those 20+ qualifiers, but I would still be applying. (This year’s Boston was my 168th full Marathon.)
Brian: I add my thanks to the others here: your work is remarkable and much appreciated. It would be even more appreciated if your prediction was lower!
Congratulations Jack – I will apply for my first time in Boston – I am at 4:50 and praying. I think for those who doesn’t live near Boston (like me from Brasil) is not so easy to go every year!
Hey Brian – quick testimonial. I had posted a comment back in January with a 4:09 buffer about being nervous it was enough and you told me you’d be nervous too based on the analytics.
So…I got to work. Just ran Grandma’s yesterday and PRed by over 7 minutes and now have an 11:30+ buffer.
Just wanted to say thank you for this tool….would have rolled the dice on my Jan time without it and certainly wouldn’t have PRed yesterday!
Well I’m not Brian but congrats, you crushed it! Next stop Boston (I hope to be there too).
Congrats! Glad things worked out for you, and good luck in Boston!
I just want to say thank you for compiling and running the data – it really is interesting.
My 5:35 buffer going to be super tight 🙂
Hello Brian,
Great tool, thanks for the impressive work you put on to make this estimate possible and as accurate as it can be.
I have a question regarding Tokyo which you do not include in the model, and from the comments I understand the rationale. My question is do you actually have access to see how many of the ~36k applicants of last year for example, did their BQ in Tokyo Marathon, or it is a supposition coming just from the number of Japanese runners in Boston Marathon?
From my point of view, Tokyo Marathon should be included in the model and here are some reasoning behind:
– 1st, we speak about a large race, with big number of participants
– 2nd, it is a fast race, with first 6-7k downhill and then pancake flat
– 3rd, as long as it is part of Abbott World Majors circuit, a lot of international runners go there and would be happy to apply for Boston Marathon if they did a BQ (I was one of them)
I don’t have numbers behind those reasons. Also, maybe I am a bit blind spotted as Tokyo 2023 was my only race where I did a BQ (unfortunately the BQ was not enough as it did not make the cut-off later in the autumn). It was my PB for a while, and last December @CIM I managed a new BQ-7:23 which I hope will get me to Boston next April.
Take care !
I do have access to the Tokyo results, and I’m going to be working on an analysis of how many qualifiers converted to applicants at Boston – there and at some other international races. More to come in the next week or two.
Hi Brian,
I follow your tracker religiously, awesome work and keep on making it better, it’s such a great resource.
Alongside the above comment about including Tokyo, I would be very interested to see if you could include Sydney marathon also in your analysis. A few points on the matter:
– This is the first year Sydney is a marathon major and it is drawing a very international crowd who are on the Six Star track and looking to BQ (I am one of them, travelling from London)
– The race has moved forward two weeks from last year (to August 31st) and is now in the 2026 qualification window
– It is not known as a fast course but they have made some adjustments to make it quicker (still has more elevation gain than any other major)
– Though it’s tail end of winter there, it can still be quite warm. The race start is at 6.30am (earlier than any other major) to help with that but it can still be an issue
Just want to know with more confidence if low 2:59’s might do it or I need to go firmly into 2:58 territory (or beyond). I am M 40-44 so need 3:05 – cutoff.
Though I’ve been living in London for the past 12 years, Sydney is my hometown. I am both excited and nervous in equal parts at the thought of BQ’ing in Sydney (and running sub 3 for the first time).
Thanks so much!
Good luck at Sydney! I don’t plan to incorporate the results directly into the tracker, but I will definitely be collecting the results and writing up a separate recap and analysis. For the reasons you mentioned, I do think it’s a possible wildcard that’s worth keeping in mind.
Hi Brian, love the tracker and the effort you’ve put in is very much appreciated. I’ve been on this page far too often nervously checking if my 5.50 buffer (run in Tokyo) will be enough.
Some interesting chat above about conversion rates above and would love to see some more detailed analysis on this if you have time.
I’ve also read a few times on your pages that the number of qualifiers is being driven by more runners. Not necessarily needing a detailed analysis but I’d be curious if you have a feeling whether there’s been a similar growth in non-US marathons and whether this will have an upward or downward pressure on the cut-off time?
And one small change which would help me – can you add a last updated date so I can see whether you’ve incorporated the previous weekend’s results?
Thanks!
Hello,
For your projection are you using a 24k field size for BQ applications?
Yes. The tracker assumes that the field of accepted applicants remains at 24,000 time qualifiers.
Hey mate
Thank you again for your hard work on this!
How much do you think the current predicted buffer (5.34) is likely to change from today (July 20th), either way, given the races left?
Thanks,
Ben
At this point, there shouldn’t be any more large changes. A small but significant number of qualifiers will come in the final weeks of the qualifying period (late August, early September), but they’re such a small percentage of the whole group that it won’t change much. Absent anything crazy (like multiple race cancellations), I would expect the final projection to be within 10 to 15 seconds of where it’s at now.
Thank you Brian! This give me confidence! Fingers crossed! 🤞🏼
Thank you for all of your hard work. I appreciate it greatly.
Hi Brian – sorry if this has been covered, but do you filter out duplicate individuals? Someone who ran 2 races with qualifying times during the period? I was thinking about this because I know someone who ran a second race to try to increase her buffer (which she did) so therefore her first qualifying time wouldn’t “count” in the overall tabulation, so to speak. I’d be curious how many folks this applies to and whether it would change the outcome.
Hi Kim. Yes, to the extent that it’s possible, I identify duplicate results and only use the best time for the calculations in the dashboard. If you follow the link for the May update (it’s in a note at the top of the page and in the list of updates below the dashboard), there’s more details.
Given that we are now less than a month from the application window closing, how many more qualifiers can we yield with a month left to go?
Also, without being a “European douche,” could your extremely unpopular president (at least abroad) and the various boycotts against the US swing the results to fewer international applicants this year? I hope “you” change your mind by the next election and happily apply anyway.
that actually could affect the buffer because if tourism is down by ~10%, and international runners make up ~10k, that’s 1k less applicants, so that affects the buffer by ~15 seconds?
Hello everyone. For those of you who aim to apply to the 2026 Boston Marathon, a pre qualification was open throughout the summer to validate qualifying times. I have submitted mine late July but have not heard back since. Has anyone having done the same received a confirmation email ?
Me and my wife made the final July submission. Neither I (-4:50 min) nor she (-14 min) received confirmation of the times.
If you’re referring to validating one’s race time, I sent in my Tunnel Vision time (-6:17) several days ago and received confirmation this morning.
The email was titled “Your Boston Marathon Qualifying Time Has Been Verified”.
My verification submission received a reply in ~6 hours confirming that it had been successfully verified. I did it early in the verification window, so perhaps it is taking longer toward the end. Good luck and congrats on your BQ.
I also submitted mine (Buckeye, AZ) and got confirmed in a few hours Guillaume. Might be time to follow up with them..
I got my time from 2024 CIM verified almost instantly back on July 21st. Maybe it takes longer depending on what relationships BAA has with other qualifying races?? Wishing everyone on the edge the best of luck. And huge thanks for the work that has gone into this site. I mentally and physically trained to beat my actual BQ time well in advance after stumbling across this predictor last year and fortunately the stars all aligned.
Is it the same for men and women?
Yes, the actual cut off is the same for everyone – men, women, and all ages.
Thanks all for your responses and apologies for spamming the forum. I submitted mine (-7:11) late July. No news since. Although I got an automatic email saying it could take up to 4 weeks and that it does not impact the official registration window, I’m surprised I have not yet received the confirmation. I will chase them.
A friend of mine just received hers this week. Her qualifying race was in Canada. I received mine almost instantly but my race was a fairly large one in the USA. I believe foreign races must be taking longer to verify.
Thank you Don. For those of the readers who may be in a similar situation, I chased the B.A.A. using the following email address: accountservices@baa.org . I received the confirmatory email that my time was pre-qualified within ~60 mins. Hope this helps !
Brian. Thanks for your effort with the tracker. Excellent piece of work. I was in the 0:00-5:00 buffer and was motivated to improve based on your analysis. I’m now at 6:17, which makes me nervous, but hopeful. I have read your assumptions and like your analysis. Sorry if you’ve addressed this question already, but were you able to link names from the Boston 2025 results to the names in your qualifier database? (I assume you do not have access to the applicant database.) For privacy, the results probably have only name, time, and perhaps the home town, so some results might get linked to a matching qualifying name but the wrong person. Anyway, I thought knowing exactly who submitted an application would help verify demographics and your models. Thanks again.
Hi guys. I received an email last week validating my time (6:53), which I reached in Seville Marathon this year. I took 36 days from the submission to the email validating my time. Those were anxious days. Hehehe. Fingers crossed!! Good luck for all of applicants!
Hey! What are your thoughts on a 6:20 buffer with only a couple weeks to go until registration? I’m stoked because I hit my goal, but scared at the same time. Thanks in advance!
Hey Alex. Congrats on the time! I think it’ll be close, but odds are it’ll hold up. At the end of the day, I think it’ll end up being in the high 5:00’s, maybe just ticking over 6:00. 6:20-6:30 is in the realm of possibility, but not likely.
We’ll have a better idea once the results from this weekend are in. But at this point, you did what you could – all that’s left to do is wait.
Not the high 5’s 😭😭😭. Time is too slow, patience wearing thin. I have a -5:21 buffer and went from being super proud (first marathon) to trying not to be super disappointed. Your tracker is my new obsession but I know it won’t trend any more favorably for me. Idk how I’m gonna be able to wait another three or so weeks for the actual cutoff time to be announced.
Hi Rock – awesome job with this, really helped me dial in my racing goals for BQ and acceptance.
Question: why do you have data for the 2026 Erie Marathon? The race is next Sunday 9/7/25. Is this data from the 2024 race somehow? There are now over 1600 entrants for next weekend…
Cheers – Jim
Hi Jimmy. Erie is in the double dip window, so by the end of the qualifying period the tracker will include the combined results of two Erie Marathons in each qualifying period.
The results that are currently there are from the beginning of the qualifying period – so the 2023 Erie Marathon is included in the 2025 column and the 2024 Erie Marathon is included in the 2026 column.
Hi there. Trying to find out where I can register my already verified time at BAA site, but something weird is happeningz An infinite loop when I click in the BAA Village button sending me to log in over and over. If anyone already finished his/her registration, could send the correct link, please? Tks in advance. Best of luck for all of us.
Probably just too early so try again. It opened at 10 ET.
After yesterday, I have a 4:06 buffer under the new qualifying times. I’m pumped up! My time of 2:50:53 was good enough for every Boston Marathon between 1987 and 2025. Let’s get it!
I have a 5:25 buffer, and to be honest, I was sure I was getting in until I decided to read Brian Rock’s website and drove myself crazy. hahaha
I just can’t belive that every single one below 44 has to deliver a sub-3h marathon! Insane!
Hi Brian,
I just wanted to say that I really appreciate all the work you’ve spent compiling the data and putting together a thoughtful and detailed analysis. I have a 6:02 buffer and I’m praying that is enough. I hope you had a great time exploring Vancouver (my home city) over the summer!
I’ve been a very avid distance runner for 25 years now, and from my first marathon in 2001 my goal was to qualify for and run Boston. I’m not an elite athlete though, and my finish line has kept moving over the years as B.A.A. standards have changed. However, this pas fall of 2024 in Chicago, and after 65 marathons trying, I did finally qualify. In fact, with a buffer beyond what I needed of 6:13. I applied earlier this week, after waiting nearly a full year to do so. An excruciating wait after so long. Decades in fact. But now I’m getting VERY worried that I could be cut off. Initially I thought that, after even exceeding my NEW standard by that amount, I had nothing to worry about. But having poured over data, and even been thinking about Sydney as a new Major, and the crazy recent popularity of all of the Majors today, I’m just so worried. When the Majors first became a think, I thought it was cool. But today they feel like an unhealthy obsession for a lot of people, and just a way to flaunt how much money you have. Many even get into Boston through exemptions, charities, and tour groups now. But I’ve been adamant not to take that route all these years. I believe it takes from the integrity of the pinnacle of all marathons. And there’s nothing wrong with raising money for a charity. That’s such a wonderful thing. But it’s not a selfless thing if you’re just expecting a Boston entry. And any non-qualifier entries end up filling up the field capacity of 30K that Boston can accommodate, and therefore creating these cutoff times beyond BQ standards, pushing people out who legitimately qualify. But…results aren’t in just yet. So, knock on wood, I suppose we’ll see.
Awesome reading – certainly helps kill the time while we all wait for the outcome. I’m on a 7.21 buffer so hopefully all ok…
I have 2 questions:-
– What would the impact be if they decide to go back to accepting only 22000?
– My marathon is a really small UK one (part of the Battersea Park Running Festival, London November 2024). This is a UKAA certified event but they couldn’t find it during pre verification. Anyone got experience of how quickly they’ll reach out now if they have any queries?
Thank you for all of your hard work Brian! It’s been great to follow. Let’s go Boston 💪🏼
Thank you Brian! It’s been great to follow this. Let’s go Boston 💪🏼
Thank you Brian for your work, let’s look for improvements to 2027 cutoff predictor. Hopefully I got with my 4:50 buffer.
Thank you, Brian for making this page. I check on this page regularly throughout my training block and appreciate your dedication and hard work here. I did make the cut off for next Boston thanks to your insight