For the latest on the possible outcomes for the cutoff time, check out the May Update on the 2027 Boston Cutoff. There are relatively few results remaining, so the projection won’t change much. But two key factors point to the actual cutoff being at least slightly higher than the final projection.
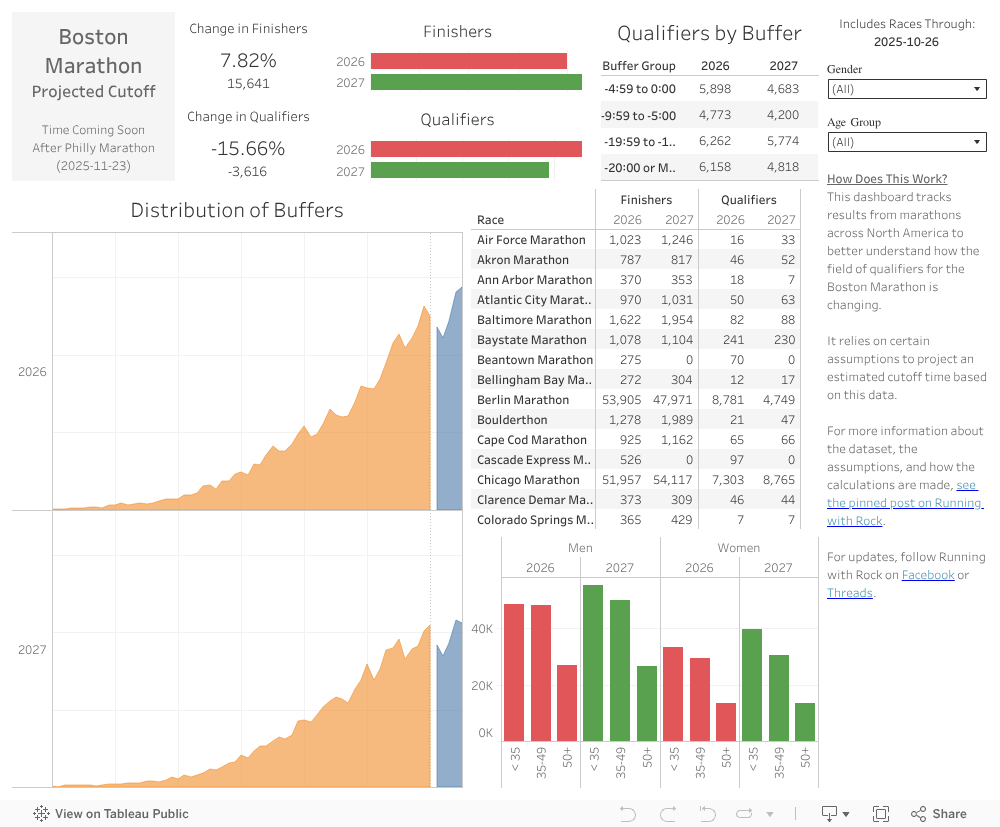
The Tableau dashboard below collects data from marathons, tracks the number of finishers who meet their Boston qualifying time, and projects an estimated cutoff time for the 2027 Boston Marathon.
I will make regular updates to this dashboard, typically on a weekly basis, through the registration period in September 2026. For more details on the data, the assumptions, and other factors, scroll down below the dashboard. I’ll follow up with a more complete prediction towards the end of the qualifying period. Follow me on Threads for the latest updates.
Want to Stay Up to Date with the Latest Data?
I will continue to update this dashboard throughout the qualifying period as additional races take place.
Every month or two, I will write up an analysis of the recent races and what effect they’ve had on the projected cutoff time. Use the form to subscribe to my weekly newsletter, and I’ll let you know when those are published.
More frequently, I’ll just be adding data to the dashboard. In the top right corner you’ll see the date of the latest results, and I’ll also post something on Threads. Follow me there if you want to be the first to know when new data is added.
How Accurate Was This In the Past?
This is everyone’s favorite question – cut to the chase and tell us how well this worked in the past!
Last year was the first year that I tracked the results throughout the year, and over the course of the year the projection ranged from as low as ~5:00 to as high as ~6:30. By the end of the qualifying period, the tracker projected a cutoff time of 5:36. The actual cutoff time was 4:34.
This prediction essentially includes two parts. First, we’re predicting the number of applicants. Based on the tracker’s projection, we expected to see 34,118 applicants. There were actually 33,249. That’s a difference of 2.5%, which is not perfect but pretty close.
Then, we’re predicting the actual cutoff time. Since the prediction of the number of applicants was slightly high, so was the prediction of the actual cutoff time. But if we knew the actual number of applicants, some simple math would have yielded a prediction of 5:16. And if we had known the number of accepted applicants would increase by a few hundred, the prediction would have been 5:02. A little high, but not off by much in the grand scheme of things.
You can read some more reflections on last year’s prediction here.
The previous year, I used similar methodology and came up with a prediction of 7:03. This was just slightly higher than the actual cutoff time for 2025 (6:51). But it also assumed there would only be about 22,000 accepted applicants.
They actually accepted 24,000 applicants. If we had known that ahead of time, the prediction would have been closer to 7:45 to 8:00. So in this case, the modeling came in lower than the actual cutoff time – but by less than a minute.
You can read more about that prediction here.
Ultimately, it’s very difficult to come up with a precise and accurate prediction of exactly what the cutoff time will be. There are a lot of unknowns that simply can’t be controlled for. But we do know enough to identify the correct ballpark, and I’d be pretty confident that the final projection will be within a minute or less of the actual cutoff time.
Keep in mind, however, that the projection will change throughout the year. It’s a roller coaster that goes up and down with each weekend’s results, especially early on in the qualifying period. While there are still results coming in, there are far more unknowns. Until the end of April, this is more like a weather vane to understand which way the winds are blowing. By the end of April, though, it’s unlikely there will be any further big swings.
What Data Is the Dashboard Built On?
For this dashboard, I’ve collected the results of marathons with 200 or more finishers in the United States and Canada. I’ve also included the results of London and Berlin, because those are part of the Abbott World Marathon Majors. Tokyo and Sydney are not currently included, because such a small percentage of their runners actually apply to run Boston, but I may change that in the future.
Based on its date, each race is classified as being in the 2026 or 2027 qualifying period. Unlike previous years, there is no overlapping double dipping period in which one race is eligible for qualification for both Boston Marathons.
Although I have the full dataset for the 2026 qualifying period, I’ve excluded the races that haven’t yet been run in the 2027 qualifying period. As the results become available for the 2027 qualifying period, I’ll update the dataset and include results for both periods.
There are some races that have zero finishers in one of the qualifying periods. If that race appears in the dataset, that means the race did not take place in that qualifying period – either because it was discontinued, it is new, or it was temporarily cancelled due to extenuating circumstances. Quite a few of these races are in early September and used to be in the double dipping period. The September 2024 race in the 2026 qualifying period has no corresponding race in the 2027 qualifying period.
The dataset includes a finish time, age group, and gender for each runner. The same qualifying times are in place for each of the two qualifying periods. The only difference in the calculations is that for races in the 2027 qualifying period, the relevant downhill results index adjustment is included. Each runner is identified as a qualifier or a non-qualifier and their individual buffer time is calculated.
The runner’s age when they ran their marathon is used to determine the appropriate qualifying time. It’s possible they age up before Boston, so the actual number of qualifiers is higher than the calculated number. But, we can assume that this difference is similar from year to year and that the difference washes out in the aggregate.
Runners are identified and have their results grouped according to a fuzzy match on their name, their age, and their gender if they’ve run more than one race in a given qualifying period. This method may miss some possible matches, but it does a good job of making most potential matches. By setting the “Use Fastest Time” option to “True,” the calculations will be based only on a runner’s fastest time. This reduces the impact of a single runner achieving multiple qualifying times in the same qualifying period.
The majority of the data comes directly from each race’s results. In some cases, the data is collected from another source, like Athlinks or Marathon Guide. I maintain a copy of the full dataset on Kaggle, if you are interested in doing your own analysis.
What Assumptions Are the Dashboard Based On?
This dashboard is based on several assumptions. These assumptions were first tested when I attempted to predict the cutoff time for the 2025 Boston Marathon, and they were refined while I tracked the results and attempted to predict the cutoff time for the 2026 Boston Marathon. The methodology is not perfect, but it holds up fairly well and is a good starting point for understanding how things are (or aren’t) changing.
The Boston Marathon cutoff time is based on three things: a) the total number of applicants, b) the number of accepted applicants, and c) the distribution of applicants’ finish times.
The biggest variable is the total number of qualified applicants. There are a lot of factors that go into this, and it’s impossible to fully account for all of them. But the core assumption that I’m starting from is that the number of applicants is directly related to the number of runners who meet their qualifying times.
Not every runner who qualifies for Boston will apply. But the percentage of runners who do apply should be fairly stable. Publicly available results allow us to track how many runners qualify. We can then calculate how that number changes. Finally, we can apply that change to the number of applicants from 2026 to project the number of applicants for 2027.
More complex modeling would take into account the runner’s gender and age, the race at which they qualified, and their individual buffer. I did take a stab at this more complex modeling last year, but it may have been a bit over engineered. This simpler approach ended up being more accurate.
The next variable is the number of accepted applicants. We can’t know exactly how many runners the Boston Athletic Association will accept. However, this has been between 22,000 and 24,000 in recent years. The last two years, it has been slightly over 24,000. There is no indication the field size will increase significantly, and therefore it’s unlikely the number of accepted applicants will grow beyond last year’s levels (24,362).
Therefore, I’m using that as the second assumption.
The third variable is the distribution of the actual qualifying times, which determines how many applicants need to be rejected to balance the field. Based on the data released by BAA when it announced previous cutoff times, I’m assuming this to be between 1,800 and 2,000 runners per minute.
Instead of simply using third variable to calculate the projected time, though, we can use a linear regression from the previous results. Over the past decade, there has been a stable, linear relationship between how many applicants are rejected and what the cutoff time is. We can simply plug the number of projected applicants into the equation and get a projected cutoff time.
With these assumptions – and the underlying data of results – it’s possible to make a simple prediction of what the likely cutoff time will be.
An Example of How the Math Works
Here is an example of how the math behind the projection works. These example numbers are based on the results available through early December.
First, take the number of qualifiers in last year’s qualifying period: 32,677.
Then, determine how much this increased or decreased in this year’s qualifying period. It decreased 1,554 (4.76%) to 31,123.
Next, adjust the number of applicants in last year’s qualifying period (33,249) by the percentage difference in qualifiers (-4.76%) to get the projected number of applicants in this year’s qualifying period (31,667).
Now, use the number of accepted applicants in last year’s qualifying period (24,362) to project the number of rejected applicants: 7,305. Convert this into a fraction of the total number of applicants: 7,305 / 32,167 = 0.22710.
Finally, plug this into the regression equation: (1230.332623 * 0.22710) – 30.316416 = 249 seconds. Or approximately 4:09.
Going back through 2015, this regression equation has only been off by more than 30 seconds once. It was 56 seconds high in 2024. In every other year, it was within 30 seconds – and in most years it was less than 20 seconds.
Always remember that there’s an element of chance to this, so it’s quite likely that the final outcome could be 10 to 20 seconds higher or lower. But it’s very unlikely that it’s more than a minute from the projection.
Can I Play With the Data Directly?
The individual results used for this dashboard is a large, raw dataset. The dashboard is designed to make it easier for your average runner to understand. I’ve invested a considerable amount of time into cleaning and processing that data to produce a simple set of visuals and a single projection.
But if you’re a data professional, you might be interested in doing your own analysis of this data – either to make your own Boston cutoff prediction or for some other purpose. I’ve published the full dataset, and you can read more about that here.
Note that this dataset does include some additional race results that I have not factored into the tracker. You can make your own decisions of whether and how to incorporate them.
You can download the dataset as a set of csv files to work on locally. Or you can create notebooks on Kaggle to work with it in the cloud.
Updates and Analyses
Throughout the qualifying period, I will include links here as I publish more in depth analysis related to the cutoff time:
- 09/2025 – The Impact of Eliminating the Double Dipping Period
- 09/2025 – The Impact of the New Downhill Results Index
- 10/2025 – First Look at the 2027 Boston Marathon Qualifying Period
- 12/2025 – December Update on the 2027 Boston Marathon Cutoff
- 01/2026 – Is Your Boston Qualifying Time Fast Enough? Here’s What the Latest Data Says
- 02/2026 – February Update on the 2027 Boston Marathon Cutoff
- 03/2026 – What Impact Has the Downhill Results Index Had?
- 05/2026 – May Update on the 2027 Boston Marathon Cutoff
Future Enhancements and Further Analysis
The dashboard is a starting point, but I plan to make some enhancements over the next few months to improve its ability to project and predict the Boston Marathon cutoff time.
First, when the dashboard initially launched in September I hadn’t yet included a projected cutoff time. There was simply too much potential for variability. In early December, I updated the dashboard with that projected finish time. Still, expect some additional fluctuation over the next few months.
Second, I’m not currently including Sydney and Tokyo. I’ve also included Berlin and London as equally weighted races. I plan to include an option to include all of the Majors and weight their results more appropriately, based on the historical conversion rate of qualifiers from those races.
Third, I wasn’t originally filtering out multiple results per runner. This is unnecessary in the fall season, when it’s very unlikely for a runner to have multiple qualifying times. I updated the dashboard in early December to account for this, and you can now toggle between seeing the full dataset or only a runner’s fastest times.
Fourth, I’m not currently attempting to age runners up and calculate their age when they run Boston. Technically, this would be a more accurate reflection of the number of qualifiers. It’s impossible to identify everyone who will age up, but it’s possible to identify some of them. I may update the tracker with this at a later date.
If you have other questions or suggestions, leave a comment below. I’m not trying to overcomplicate things, but I am open to suggestions to make the tool more useful.
Here we go again! Taking it easier this time — got my BQ for Boston 2026!
Please keep doing the great work!
Boston saw a huge spike last year. Would you agree that it is unlikely that even more people will qualify for Boston in Boston this time?
I’ve ran 5:42 minutes under my 3:00:00 qualifying time. Fingers crossed it’s enough 🤞
I was confident that my 5:21 should be enough but with every week the gap is closing.
uh oh
thanks for this! i look forward to updates. I just ran a 3:41 at Richmond. This is 9 minutes below 2027 time for 60-64 year old males (my age group). how safe am i?
Hi Martin. Congrats on the strong finish! I think 9 minutes is pretty safe regardless of what happens. There’s an outside chance it could rise to ~7:00, and more likely to be in the 5:00-6:00 range. The spring races will narrow that down, but there’s pretty much no scenario where it gets to the 9:00+ range.
thanks for the reply! i’m cautiously optimistic. happy trails.
ps: as an economist, i truly appreciate the data dives.
Congratulations on your time, I just ran 3:40:26 in the 60-64 age group, so I’m in the same boat as you. Hopefully we’ll both be going to Boston. I missed 2025 by 6 seconds.
kicked my butt! nice job! fingers crossed.
and way to bounce back after the 2025 disappointment…very resilient.
Hey Brian! Excited to see your first projection for this next time and reasoning for analysis! Any idea when that might come? It seems like more finishers but less qualifiers. With that said the velocity of qualifiers seems to be rising fast that would lead be to think final numbers will be an increase in qualifiers.
I plan to have a basic analysis done in the next week or two – with a more robust prediction to come in early January.
Still need to dig into the data a bit, but what I’m seeing so far is a steady increase in finishers – interspersed with some weather related dips (Berlin, Twin Cities, etc). There was also a built in dip in qualifiers (caused by the elimination of the double dipping period) to overcome.
Once the springtime comes, I’m pretty confident the YTD qualifiers will be in positive territory. And unless London has really bad weather again (unlikely two years in a row), it could be in big positive territory.
All signs are pointing up … But the question is how high. Tbd.
Looks like qualifiers are up this year, excluding Berlin. Do a lot of Berlin qualifiers actually apply for Boston? What about other big, international marathons still to be run (eg, London and Tokyo). Thanks.
The share of qualifiers from Berlin who run Boston is lower than most US races. The same is true for London. ~15-20% of BQs from those two races will result in Boston applicants, compared to ~30-40% for most US races. Tokyo and Sydney have even lower conversion rates (and that’s why I don’t include their results in the tracker).
So yes – the projection is currently being held down by Berlin, and its impact is probably over weighted a bit. But given the bad weather at London last year, there will likely be a large surge in qualifiers coming out of London. It has a similar conversion rate of BQs to applicants as Berlin – so the two will likely more or less cancel each other out.
I appreciate this work and look forward to your initial analysis as well as the refinements that come with the additional winter and spring marathons. I got nailed in the 6:51 cutoff for 2025 and pivoted to run Chicago for 2025. Great place to run a fast marathon with the insane energy of the city pushing you towards the finish! Loved it! Got my BQ with my 3:06:54 which is a 13:06 cushion, so I’m highly confident I’ll be back in Boston in 2027. This will be my 9th Boston, my 8th on the historic course (God bless 2020), and my 7th on Patriot’s Day (2021 was in the fall). Chicago was amazing, and I highly encourage anyone who hasn’t run it to put it on the list of marathons to do, but it’s not the tradition, allure, and history of Boston. I’d still go back to Chicago sometime as it is a fantastic marathon and a wonderful city!
similar story. I missed a cut when I raced in Berlin so I switched to Chicago. The race was great even with that big steepy mountain at mile 26.
I’m at 5:21 cushion. It’s close but hopefully will be enough. I think everything will be clear after London.
Hey Jonathon! This blog post didn’t happen to be during your fall social media lent, did it?
Looking forward to an update! Thanks for your analysis. It’s both fun to see the numbers and useful for a Boston 2027 hopeful. I ran a PR at Twin Cities this fall, managing a 6:30 buffer, but will likely try to run another race this Boston qualifying season to get closer to 10 minutes, given the weather at Twin Cities was less than ideal and the increase in qualifiers.
I love seeing your work. If I might offer an asterisk, I BQed twice, though it would not be obvious from the race results. The 2024 Indianapolis Monumental M75-79 and Garmin KC 2025 as M80+ as an impaired athlete. BQ time standard <6:00:00. I sincerely appreciate your including an M80+ category. As I am about 8% of the registered runners in that age group for 2026 it may be of some statistical significance.
Is there a chart that display the movement of the cutoff time week-to-week or month-to-month? It’d be cool to track it with data points on a graph each week/month to see which months/races are really moving the needle.
How safe do you feel a 02:58:09 (6:51 under 03:05 AG 40-44) is in September?
I’d feel pretty good about it. Given the weather outlook for both Boston and London, I have a feeling things are going to shoot up over the next two weekends. But I doubt it’ll get that close to 7:00. Maybe between 5:30 or 6:00, possibly low 6:00’s. After London, I think we’ll have a pretty good idea of what the worst case scenario is going to be.
thanks Brian! I greatly appreciate the work you do!
Now that you have Boston’s data in here, do you believe it might get close to 7:00? Sitting on a 7:27 buffer and starting to get nervous…
Brian, I have a hope that Boston is implementing the new 6 wave start and separate feeding of the top corrals as a trial this year with a bigger purpose. If they can load & start 6 waves worth of runners in the same amount of time as they used to load and release 4 waves of runners, it seems that they might then be able to expand the field in subsequent years while keeping the same course closure schedule as in previous years. That’s my computer engineering view of things! Are you aware of any rumblings of an expanded field for next year?
I suppose it’s possible … but I doubt it. I was under the impression the additional waves were more of a way to smooth out the start logistics and prevent people from getting crammed up at the start.
Anecdotal observation: it was still really crowded on the course. I found the “flow” with the feeding of 1-3 and 4-6 a tad smoother. As much as I’d like to return, I’m not thinking they can handle more participants, even with the distribution through 6 Waves. Anyone else have thoughts on that?
Oh man…I’ve been fortunate enough to run Boston three times but have qualified and missed the cutoff these last several years (2:58-59’s as a late-30’s male). Aging up to 40 in 2027, with MCM 2026 yielding me a -6:32. I was feeling pretty good about my chances until these insane Boston times. Based on what’s left, how good are my chances now?
I watched the race this year (perhaps you can guess why I’m hoping for an expanded field) right across from the Spencer the dog statue, so about 3 miles down the course. I can state that the waves at this point were clearly identifiable, with a huge crowd at the start of each wave, followed by a thinning out of the crowd, then very sparse crowd, then the next surge. It’s natural for this runner to think that he is under-seeded, feel those downhills, and want to fly; the wave becomes a tear drop, so the crowding is probably folks in rear corrals running up the backs of folks in forward corrals. It seems though that the course could hold more people at that point, but only at the tail of the teardrop.
I would love to hear from experienced Boston participants how that start felt from their perspective and if those corrals felt any more spacious with the 6 wave start than the 4, especially in the higher-numbered corrals. I concede that you are probably correct that my theory is hopeful, but hope is why we’re here, in general and also reading this particular blog.
Thank you for what you do.
You were watching from Ashland!
To be honest, it seems they had a lot of trouble with the buses this year (being late, wrong turns, getting lost) so that could be a handbrake to any plans to increase numbers
It was packed, to the point where they couldn’t fit everyone into the corrals. It’s like they didn’t measure how big the corrals should be compared to how many people were in them.
Getting everybody out there has always been problematic from my point of view. In the four or five years that I’ve taken the yellow bus option I’ve been on two lost buses.
Thanks for the insights on the corral situation. I’ll have to let the hope for an expanded field go and only focus on running faster.
I have no “inside insight,” but I’m an experienced Boston Participant. I didn’t notice much of a difference with the 6 Waves and feeding in from 2 separate lines. Maybe the standing in the corrals at the Start line was less… maybe. Definitely did not experience any additional elbow room.
The number of BQs in this year’s Boston Marathon is insane. Not only it will spike up the expected cuttoff but also will make it more difficult to estimate by introducing more variability.
London’s weather forecast looks good but not as perfect. Given the performance trajectory of the international Marathon running community, I would say that it will also be above last year’s figures.
And just like that we can be getting to 6 or 7 minutes cuttoff again which can trigger the BAA to review the standards for 2028 on (unless this 6 wave system somehow does allow for the increase of size of the field).
Thanks for your great work! I am trying to qualify for 2027 next Sunday in a local race here in Portugal and on the side of caution and based on your great info, I will pace it to aim for a 10 minutes buffer.
As a 30 yr old male with a 5:14 under 2:55 BQ, should I feel super nervous?
Unfortunately, yes. Unless something changes (like they add more bibs for time qualifiers), the odds of a 5:14 getting through at this point is pretty low. Hard to say for sure until after London, but the best case scenario at this point is probably 5:30 to 5:45, with a possibility of a cutoff in the 6:00’s. Things could change, but hard to see how they drop far enough to be back below 5:15.
Again, that’s assuming the field size for next year is similar to recent years. A larger field would shake things up for sure.
I am sitting at -5:12. Fingers crossed!
Looks like the big difference with Boston 2026 vs 2025 was the number of finishers with a 7+min buffer. Almost the entire 3,000 BQ difference comes in this range. Got me nervous with a 6:44 buffer right now. How much change do you typically see from Boston weekend through the end of the summer? Of course London could have a big impact, but outside of that, there aren’t a whole lot of summer races with good courses and weather.
Once London gets baked in, things shouldn’t change too much. There are a decent amount of remaining results, but Grandma’s is the only real big race left. Collectively, they might nudge things up or down a little bit, but there shouldn’t be any more big swings after next week.
I noticed the same thing about people with deeper buffers. If that distribution is different, it could shake things up a bit. But it’s harder to do that modeling until the full year is done. Come September, that could point towards the outcome being a little higher or lower than the actual projection.
One side story I’ll be interested to see if you follow up on is the downhill marathons. I’ve run a few and I’ve always been a few minutes slower on them compared to flat courses, because my quads get tired around mile 16 and I slow down by 15-30 seconds per mile at the end. I’ve always thought the ideal course (for a fast time) is flat for the first half, and then downhill in the second half (when you start to get tired). This would spread the work out on different muscles. It looks like some courses have gone this route, like Tucson and Tunnel, to not get penalized for BQs. I’m curious if times will get better, worse, or stay the same on these altered courses.
Thanks for the fast update after London.
I qualified yesterday (not in London but in a local official race) with a 13 minutes buffer but a friend of mine finished with 5:19 below his AG standard. I guess he will biting his nails until September.
Is there any buzz about BAA increasing the field after this 6 wave start that, as far as I know, is being viewed as a good move?
Brian, not sure if you have any additional insight here, but since you’re the GOAT of Boston Cutoff analysis, figured I would ask. While playing around the data, I noticed that the huge jump here is in qualifiers under 35 (more than 11%), while qualifiers over 35 is actually DOWN this year. As we look at future years, any chance the BAA looks to separate out finishers below 30 into their own bucket (ala NYC and Chicago), or apply qualifying standard changes only for 35 and below? They clearly need to drop times again, but doing so evenly across all age ranges feels like it would have a huge impact on the number of folks running 35 and up.
It’s hard to gauge the magnitude, but there are definitely _some_ people who do not want to travel to the US at the moment. I’m making no comment on the politics of that, however we can be sure that this won’t increase the numbers of international applicants, though it may reduce them slightly. It’s not going to swing the numbers significantly, but if your buffer is right on the cusp…
Hey man! I saw you were already on it a while back but I ignored it because I got in this year! 🙂 So, I ran Boston a hair slow, Newton Hills got me, but I’m still a 6:39 buffer, so if we don’t get London, we have a decent shot at Boston #2. I’ll be keeping my eye on the tracker. Last year I was hoping to meet you in Boston. Is it a goal for you this time around?
Hey guys, sitting at a 6:06 buffer and definitely nervous after that last week or so. Had no plans to run another marathon within the qualifying window but wanted to get your perspective on a 6:06 buffer.
What are the chances the buffer goes out that far? Do I need to run another race although not 100% I could improve on that time.
Don’t listen to me, but my guess is that you get in my the absolute skin of your teeth. Just my gut, but i think the last chance marathons this year are going to be packed, and if they have good weather, the numbers will move. But I doubt by >35s.
This is a great site, thanks for maintaining it. I am impressed with your analysis and predictions.
“I’m not currently attempting to age runners up and calculate their age when they run Boston. Technically, this would be a more accurate reflection of the number of qualifiers.”
One simple and accurate step you might take is to add one to the age of every finisher who does a race that occurs between Sept 13, 2025 and April 19, 2026. 100% of those people will be at least year older on the April 19, 2027 date of next year’s race than the qualifying marathon they completed.
It is tougher for the marathons between April 20, 2026 and Sept 2026 as you cannot know with certainty that those people will be a year older, but perhaps you could do a simple probabilistic calculation. E.g. if the qualifying marathon was 36 days after April 20, 2026, then there is a 90% chance that the person will be a year older for next year’s Boston Marathon.
This is great, thank you for putting this page together.
I am a race director and if you are ever interested in taking a trip out west and doing one of our events including like the Bakersfield Marathon (CA) or the Havasu Half Marathon (AZ) then please reach out. I would gladly comp your entry to thank you for the service you are providing to the running community with this site.
Thanks Gavin – appreciate it!
i use it centenially when i’m in my greenhouse.
Thanks for all the hard work you do! I’m sitting at 7:05 below buffer. I feel like with all the major marathons and the summer heat keeps the cutoff right where it is.
I’m sitting with a 2:49:06 as a 23 year old. Do you think I have a chance?
Chase, that’s a great time. I’ve been marathoning now for 26 years through 69 marathons, and have kept a close eye on Boston for all that time. As of right now I think you might be right on the threshold, and just make it in. But I wouldn’t count on it just yet. Boston if nothing else has taught me patience and tenacity, through a whole lot of disappointment. It took me my first 24 years and 65 marathons trying before I finally made it into Boston for 2026. Would certainly have rather run it much sooner. When I started trying I guessed it might take me just my first 2-3 years trying. But I will say that when I finally did get to run it this year, it was just insanely satisfying. Like something straight out of a movie after that long. Really hope you make it in, but if not, just keep at it!
Thank you so much for your work, I truly appreciate it. I’ve been checking the updates every week. I have a 5:32 gap and I hope they increase the number of applicants allowed so it stays as low as possible. The fact that it’s currently at 5:26 makes me nervous.
I apologize if this was already discussed and I missed it. Do you believe the new two day London format (+50k participants) in 2027 will impact registration for Boston ‘27?