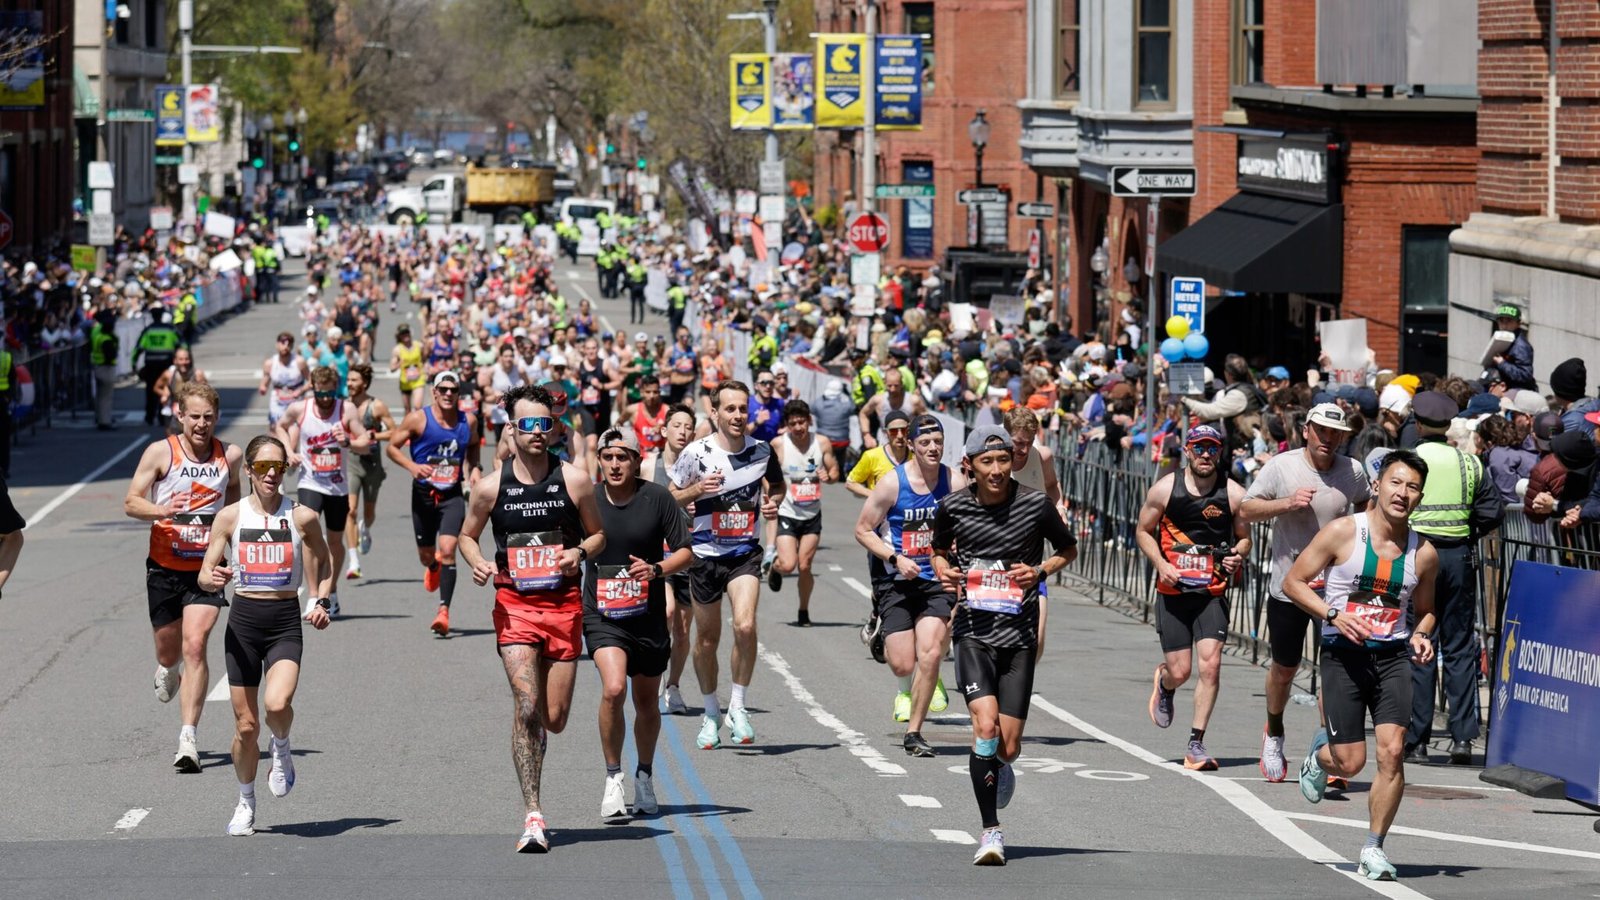
The BAA has announced the number of applicants for the 2026 Boston Marathon: 33,267. That’s slightly lower than expected, suggesting that the cutoff will also be slightly lower than prediction. Here’s a revised prediction that takes these numbers into account.
It’s finally here: registration week for the Boston Marathon. For the better part of the past year, I’ve been tracking the results of races with the Boston Marathon Cutoff Time Tracker to project the likely cutoff time. There’s only one race left to run on Friday, and at this point the data is about as final as it will get.
So it’s time to take a deeper look at that data and come up with a final prediction for the cutoff time for the 2026 Boston Marathon.
If you want the short version, the tracker is currently projecting a cutoff time of 5:36. The second dashboard I built to focus on the number of applicants is projecting just under 35,000, which would yield a cutoff time of about 5:40. These two different methods both agree on the general outcome, so I’m pretty confident that it will be between 5:30 and 6:00.
Keep reading for a more thorough explanation of how we got here, how I came to this projection, and what is still in flux.
What Data Was Used For This Analysis?
Throughout the year, I’ve tracked the results from a large sample of marathons. The main dataset includes every race in the United States and Canada with more than 200 finishers, the London and Berlin marathons, and a handful of smaller races that are of particular significance.
To the extent that it’s possible, I matched multiple results from a single runner and used their best time. As each race was added to the database, I used fuzzy matching to compare the runner’s age, gender, and name to the existing results and look for duplicates.
Here’s an overall summary of that data.
| Qualifying Period | 2025 | 2026 |
| Races | 265 | 259 |
| Finishers | 556,215 | 617,303 |
| Unique Finishers | 495,643 | 553,418 |
| Qualifiers | 75,345 | 70,008 |
| Unique Qualifiers | 65,604 | 61,484 |
I also collected the results from the Tokyo and Sydney Marathons. However, due to the low conversion rates of qualifiers from those marathons, these results were not incorporated into the tracker. More on that later.
How Does the Boston Marathon Cutoff Time Tracker Work?
The tracker is built on a set of simple assumptions. You can read about it in more depth at the bottom of this page.
First, the cutoff time is determined primarily by the number of applicants.
Second, a consistent percent of qualifiers will actually apply to run Boston.
Third, by calculating the change in the number of qualifiers from one qualifying period to the next, we can estimate the expected change in the number of applicants.
Fourth, by determining the number of applicants that need to be cut, we can estimate an actual cutoff time.
Last year, there were a record number of applicants: 36,393. The field size for time qualifiers was 24,069. That meant 12,324 applicants needed to be cut – resulting in a cutoff time of 6:51. That works out to approximately 1,800 applicants per minute of buffer.
The key question, then, is how much the number of qualifiers changed from last year to this year.
What Factors Influence the Number of Qualifiers?
There are a few things that can influence how many qualifiers there are.
The first is obviously the qualifying times. When the BAA made the times tougher, everyone expected the number of qualifiers to go down. If everything else remained constant, these tougher times should be expected to reduce the number of qualifiers by 20% to 30%. That wouldn’t fully eliminate the cutoff time, but it would bring it down to 1 to 2 minutes.
However, not everything remained the same. If the number of finishers increases and a similar rate of runners qualify, the number of qualifiers will necessarily increase as well. For the last several years, the number of finishers has increased. Last fall, I expected that to plateau … and it didn’t.
Across the board, the number of finishers tracked in my sample increased by well over 10%. This rising tide effect increased the number of qualifiers, blunting the impact of the new qualifying times.
A third factor is goal setting. When runners are aiming to qualify for Boston, they start with the goal in mind. If that goal moves – because the qualifying time moves or because their expectation for the cutoff time moves – they’ll aim higher, train harder, and, at least in some cases, hit that time.
If you applied the same qualifying standards from the 2026 Boston Marathon to both qualifying periods, the qualification rate was higher this year. Once the goal post was visible, a slightly higher percentage of runners hit that goal post.
What Does the Cutoff Tracker Project?
In short, the cutoff time tracker shows a 6.28% reduction in the number of qualifiers from last qualifying period to this qualifying period. That’s far less than what you would expect based on the new qualifying times alone.
This is driven in large part by a significant increase in the number of finishers. The visual below breaks those increases out into the individual Majors, a group of high conversion rate races (i.e. downhill races, last chance qualifiers, etc), and the remaining “normal” races. These normal races make up the majority of all finishers in the sample.
Across the board, the number of finishers was up consistently. Some of the larger Majors only saw modest increases (Tokyo, Boston, Chicago, New York, London). Berlin saw a huge increase, likely a result of it being the race’s 50th anniversary.
Notice that Sydney had a huge influx of finishers. In part this is because the race grew. But it’s also because there were two Sydney Marathons in this qualifying period. Set that aside for now, because Sydney isn’t a in the cutoff tracker dataset. But we’ll come back to this.
Then there’s the 37,000 (12%) increase across the bulk of the races. This accounts for a greater share of the increase than the other races combined, excluding Sydney.
The only place where the field shrank was among these high conversion races. And that was largely because of a couple of key cancellations.
If you reduce the number of applicants from last year by 6.28%, you get a projection of 34,108 applicants for the 2026 Boston Marathon. Assuming that the field size remains the same at 24,000, that means 10,108 applicants need to be cut.
Sticking with the assumption that 1,800 runners are cut with each minute, you get a projected cutoff time of 5:36-5:37 (depending on rounding).
What Could Be Wrong With This Methodology?
One potential issue with this methodology is that it requires us to treat every race equally. The qualifiers at each race are equally likely to apply to run Boston.
Early on, this meant that the Berlin Marathon had an outsized impact on the projection because of its huge surge in finishers. But Berlin has a relatively low conversion rate – especially compared to Boston or Chicago.
We’re stuck with a binary choice. Include Berlin or don’t include Berlin. I decided to include it – but I decided to exclude Tokyo and Sydney, which have lower conversion rates than Berlin.
The visual below shows how the number of qualifiers has changed – and highlights why this could be problematic.
There were several large swings in qualifiers at large races. London, Tokyo, and Chicago were down. Boston and Berlin were up. Meanwhile, the larger group of normal races had a larger decline – ~13-14%. That’s masked, in part, by the large swings in the bigger races.
The decision of whether and how to incorporate these races can have a big impact on the projection. Including Sydney and Tokyo would wipe out most of the decline. On the flip side, keeping them out and eliminating Berlin would bring the average down.
What Questions Are Lingering About the Projection?
Here are a few of the questions that have come up throughout the year with regards to the cutoff tracker and its projection.
Is Berlin weighted too heavily? A large chunk of the increase in finishers and qualifiers came from the Berlin Marathon. But it’s generally a smaller source of applicants than the other Majors.
What happened in Chicago? The weather was warm-ish, but that doesn’t fully explain such a large decrease in qualifiers. The shift is likely a result of the Age Group World Championships being held at Chicago in 2023. Is this causing the drop in qualifiers at Chicago to be exaggerated?
Is London weighted too heavily? The London Marathon saw warm weather this year, and the number of qualifiers dropped accordingly. But for the same reasons as Berlin, it’s possible that this large drop is being weighted too heavily in the algorithm. More on London here.
Is Boston weighted too heavily? A few commenters raised the question of whether runners who re-qualify at Boston will apply a second time. Boston had great weather this year after poor weather last year, leading to a huge swing in qualifiers. Based on my analysis, though, Boston runners do often repeat from year to year.
Should Tokyo be included in the tracker? Many people have made this argument. It’s been excluded because the vast majority of runners are from Japan and very few Japanese runners come to Boston. The weather at Tokyo was warm, leading to a drop in the number of qualifiers. But this could distort things if those qualifiers don’t actually apply. More on that here.
How do we think about Sydney? It’s a true wildcard. The number of qualifiers has exploded, thanks to both the increase in size of the field and the inclusion of two editions in the 2026 qualifying period. It also hosted the 2024 Age Group World Championships. While the 2023 Sydney Marathon may have had a very low conversion rate, that could change. More on this here.
What happens with new and canceled races? This qualifying period saw a returning race (Twin Cities) and a couple large new races (Las Vegas and Every Woman’s Marathon). But there were also some large cancellations, including REVEL Big Bear, REVEL Rockies (now retired), and Carmel. Do these runners just disappear, or are they displaced into other races? Yet another wild card.
Will international runners boycott Boston? Back in the spring, there was a lot of buzz around this question. Personally, it reminds me of the theories last year around Easter. While I’m sure some runners have very strong opinions and a small group of runners may skip Boston in 2026, I doubt that this will have a meaningful impact on things.
What Do We Know About Conversion Rates That Could Help Us Out?
If we could estimate what percentage of runners actually convert to Boston applicants from different races, we could better incorporate the results from the various Majors.
I analyzed this question, based on the results of the 2025 Boston Marathon and the data from last year’s qualifying period, and here’s what I found:
- The majority of North American races, including Boston, Chicago, and New York, have a conversion rate of approximately 30-40%.
- There’s a small subset of races, including downhill marathons, last chance qualifiers, and some other fast races with much higher conversion rates of 70-80%.
- London and Berlin each had conversion rates of about 18%.
- Tokyo had a much lower conversion rate of about 12%.
- The 2023 Sydney Marathon had a conversion rate of just over 5%. But again, this could change for 2024 and 2025.
I also analyzed some other factors, including age, gender, and a runner’s buffer, to see if they had an impact. Age and gender had a small impact, but a runner’s buffer had the biggest impact.
Runners with a 5:00 to 10:00 buffer had the highest conversion rates. Runners with smaller buffers, closer to zero, had slightly lower conversion rates – likely because they assumed they wouldn’t get in.
Then, as you move past ten minutes into faster and faster times, runners become increasingly less likely to apply. My assumption is that this is because runners who are 20 or 30 minutes beyond their BQ are less concerned about running Boston. They’ve likely checked the box if they wanted to, and now they’ve moved on to bigger and faster things.
Predicting the Number of Applicants
I combined these factors into a second dashboard which predicts the expected number of applicants across the full spectrum of buffer times.
The key advantages of this dashboard are:
- It incorporates Sydney and Tokyo Marathon results.
- It weights results differently to account for the varying conversion rates between runners.
- It predicts the number of applicants from zero up to a full race – instead of counting backwards based on the decline in qualifiers.
You can read more about the details on the page with the dashboard. But in short, it applies weights to each qualifier, totals up the number of weighted qualifiers, and then calculates a conversion rate to achieve the actual number of applicants for the 2025 Boston Marathon.
That same conversion rate is then applied to the weighted qualifiers from this qualifying period to predict the number of applicants expected in this year’s race. And since each weighted qualifier is assigned a buffer, we can then sum up the cumulative total number of applicants expected at each second.
This is a new method I’ve developed this year, so it’s untested. But the data the BAA released about the number of applicants with certain buffers last year offers some validation that this works. The calculations properly align with the expected number of applicants at BQ-20, BQ-10, and BQ-6:51.
The dashboard predicts 34,724 applicants. Based on their distribution of buffer times, the predicted cutoff time would be 5:40.
The visual above shows these projections. The top line shows the projected number of applicants along the range of possible buffers. The field size (24,000) is marked by a horizontal line and the 2025 cutoff (6:51) is marked by a vertical line. Note that they intersect with the projected data for 2025.
If you look for the point where the projection line for 2026 intersects with the horizontal field size line, that’s what the likely cutoff will be. And that intersection is right around 5:40-5:50.
Note that the way this dashboard is set up, that projection will increase when the results of Friday’s final race are incorporated. So the final prediction of the number of applicants will be slightly higher.
So What’s the Final Prediction?
That’s a fairly thorough summary of the analysis that I’ve done throughout the year – and what the two different dashboards are saying. One method is tried and tested from last year, and the second seems to be quite plausible. The fact that they offer complementary predictions is a good sign.
At the end of the day, there are some unknowns that we just can’t account for. So I’m hesitant to say the cutoff will be X:YZ. Because the reality is that it could easily vary slightly higher or lower. But it feels more like a “prediction” when you’re specific. So I’ll apply a little bit of intuition and declare that the prediction is 5:47.
We’ll see in a couple of weeks how well that holds up.
But on a more serious note, I feel pretty confident that the actual number of applicants will be between 34,000 and 35,000 and that the actual cutoff time will be between 5:30 and 6:00. I’d say there’s a much smaller chance that it’s as low as 5:00 or as high as 6:30. I don’t think it’s likely at all that it’ll be outside of that range.
Based on recent years, we’ll likely find out the number of applicants next week and we’ll learn the cutoff time on or around 9/24-25. Until then, good luck! I hope your buffer holds up, whatever it is.
And if it doesn’t … please don’t shoot the messenger. I just read the tea leaves, I don’t determine fate!
Brian, many thanks for your months of awesome work on this. It’s really been fascinating to see this project unfold and watch how buzzed-about it has become in running circles (or at least among those of us obsessing over the projection and its ups and downs). Wherever the number lands, it’s been quite a trip, and your expertise, enthusiasm and energy are appreciated.
Thanks for your analysis and the time you put into explaining how the prediction came to be..According to the prediction, my buffer is big enough that it’s unlikely I won’t get a bib so your work enabled lots of sleeping well at night
Thanks for all your hard work you put into this. Really interesting stuff. I might have missed it but I was wondering whether you have taken into account that the qualifying times have been lowered by 5 minutes in all age groups from 18-59 for the Boston Marathon 2026 (see here: https://www.baa.org/races/boston-marathon/qualify/history-qualifying-times). That should lower the cut-off times naturally by more or less 5 minutes.
Addition: sorry I just noted you comment on that in the beginning. however you expect it to be absorbed almost completely. I find that surprising just looking at the constant qualifying times in previous years. Yes the cut-off times kept increasing but didn’t jump about 5 minutes. So I would definitely expect the cut-off times to decrease significantly, aprox. 2-3 minutes. Thus I would bet on cut-off times below 5minutes in total. 🙂 which would help me over the fence 😛
We’ll see soon, eh! Good luck!
He is accounting for the 5-minute drop.
“If you applied the same qualifying standards from the 2026 Boston Marathon to both qualifying periods, the qualification rate was higher this year.”
It would be 10:47 cutoff prediction by last year’s qualifying standard.
I hope it’s 4:02 so that my friend (4:03) and I (4:27) get in.
He is accounting for the 5-minute drop.
“If you applied the same qualifying standards from the 2026 Boston Marathon to both qualifying periods, the qualification rate was higher this year.”
It would be 10:47 cutoff prediction by last year’s qualifying standard.
Brian, thank you for the thoughtful analysis and balanced commentary of a subject that excites, motivates, and frustrates so many of us in the running community. Needless to say, it can be an emotional topic after all of the time and hard work put into training and preparation. Your articles have been enjoyable to read and I look forward to each new installation. Good luck to all those who register this week.
Thank you for your work. I’m hopping you are a little wrong. But thank you.
Brian, what is your qualifying time? My buffer is 5:00… so I hope for Chicago instead, and try a BQ+bigger buffer this spring. Thanks for all the great analysis!
After reading i decided not to fill out the application with my buffer 03.26.
Thanks Brian, I’m glad you’re doing this. All of this analysis is right up my alley and I would get lost down the rabbit hole if I started to try and do it myself. My whole life would be training runs, Boston Marathon cutoff time analysis and sleep, lol.
It will be interesting to see what impact Sydney has on the actual results. I’m from Canada and ran in Sydney this year (as I’m closing in on running all the majors)…posted a huge PR and ran almost 8 minutes under BQ…and I just applied to run Boston next year.
Anyway, thanks again!
Applying with my 43s buffer just to thwart future reliance on this statement and keep the unpredictability as high as possible:
“Runners with smaller buffers, closer to zero, had slightly lower conversion rates – likely because they assumed they wouldn’t get in.”
Thanks as ever Brian!
What I’m interested to see play out, and the dashboard unfortunately can’t predict, will be how the psychology of the new cut-off times will affect the number of applications.
I’m expecting a boost in applicants this year with cut-off times between 0 and 5 minutes, as the tougher qualifying times will encourage more to apply with the hope of being successful. It’s already clear from the comments that people who haven’t been following your analysis are expecting a far lower cut-off. Much of this group was also the equivalent of those with a 5 to 10 minute buffer last year who had a high conversion rate.
What will be particularly interesting, and may have the biggest impact on the cut-off, will be how many of those with a 5 to 10 minute buffer will apply. There was a low conversion rate of runners with an above 10 minute cut-off last year but how much more likely are they to apply now that the qualifying times for most have toughened? As one of those runners, I’m both looking forward and nervous to finding out!
Awesome analysis. While I’m certain you haven’t had the time to look into it (what you’ve done is truly incredible!), I’m curious if you know what the projected cutoff would be if the elevation qualifying rules were in place for 2026?
I’ve done some work on this – and the short answer is it could make a difference of about 30 seconds (or less). Now that the whole qualifying period is over, I’m going to return to this topic in a couple weeks.
Does your -5:47 prediction bake in your gut feeling that you’re underestimating something since you’re analytics has it at 5:36? Or is your gut telling you it can be even lower?
Yes, the 5:47 assumes that there’s something unaccounted for and/or that the trajectory is pointing upward – and therefore the final outcome is likely to be a little higher than what the modeling shows.
It’s possible that it’s lower, but I don’t think it’s likely. I think the only thing that could push it lower is if there really were a significant number of international athletes who skipped out on this year’s race.
Thanks! Sorry for my terminology. By lower, I meant faster. I.E., if you’re thinking the buffer would be over 5:47. But you answered my question
Sunday 9/14 Update. My pending transaction for Boston registration has dissapeared from my banking information. I’m guessing this is an early sign that I didn’t make the cut. I had a 5:39 buffer. Anyone else seeing this on their transaction page?
No that was just a hold. Everyone’s disappears regardless of your buffer
You aren’t done yet.
Hi Brian. That’s totally normal, and it doesn’t mean you were cut. The hold is temporary, and most people will see it drop off this week – and then get charged again later if/when they’re accepted.
I mention this in the FAQ here: https://runningwithrock.com/boston-2026-cutoff-faq/
Brian and Donald, thanks for this information. It’s great to hear I’m not yet eliminated. I’ve missed the past two field cuts by (1:15 in ’24) and (0:23 last year). I have a feeling this one might be even closer than those.
With the total number of applications announced by BAA (33,267 qualifier entry applications), do you think the cutoff will drop or increase around your prediction?
According to ChatGPT, using the same model, and considering 33,267 qualifier entry applications; cutoff time prediction should be around 5:10. Fingers Crossed!
I added a link at the top of the page to a revised prediction. The slightly lower than expected number of applicants suggests a slightly lower than expected cutoff. In the range of 5:00 to 5:30, instead of 5:30 to 6:00.
In 2024, there were 33,000 qualifiers who applied. The cutoff ended up being 5:29 with 22,000 runners accepted and 11,000 runners being left out. For simplicity, assuming an even distribution of runners under 5:29, that is about 2,000 runners per minute. If the 2024 Boston Marathon had accepted 24,000 runners the cutoff that year would have been closer to 4:30.
There were 33,267 runners that applied for the 2026 Boston Marathon. Assuming 24,000 runners are getting accepted, you are looking at 9,267 runners being left out. Assuming the same distribution of runners gets you a cutoff time of 4.63 minutes or 4:38.
I used nice round numbers for this estimate, so my best guess is a cutoff time between 4:35 to 4:55. So there is hope for those with a BQ time of -4.5 to -5 min.
The one complication here is that the distribution of runners under 5:00 looked pretty different last year. In 2024, there were ~2,000 runners per minute. Last year, it was only ~1,800. More applicants overall, but fewer applicants per minute at the low end of the buffers.
My assumption is that in 2024, the cutoff came as a surprise to a lot of people. After two years of no cutoff, everyone applied. But in 2025, everybody assumed there’d be a cutoff – altho 6:51 may have been higher than they expected – so a lot of people with buffers under 1 or 2 minutes probably didn’t apply.
While there’s some debate over what the actual cutoff will be, I think it’s pretty universally accepted that there will be some cutoff – so this year will also likely have fewer of those applicants at the 1, 2, or 3 minute end of things. If the distribution is more like last year (~1,800 runners per minute), you’ll still end up a little over 5:00.
Cutoff time announced by BAA on 9/23/2025 is 4:34. My calculated estimate of 4:38 was within 4 sec.
Where did you publish it?
The 4:38 cutoff projection was mentioned in a comment above on September 15, 2025 at 12:24 pm after the number of applicants was announced.
I think you are trying to hard in gathering data. This is the second year in a row, I have predicted a closer time to the actual using far less data. Basically, modeling the six majors (I personally don’t count Sydney as a major, just a wannabe like LA or Houston or any of the mid-majors). I use good-enough is good-enough analysis. But hey, maybe next year I will be really wrong and you can laugh at me.