Feature image from Wikimedia Commons, by Sashimi-b, CC BY-SA 4.0.
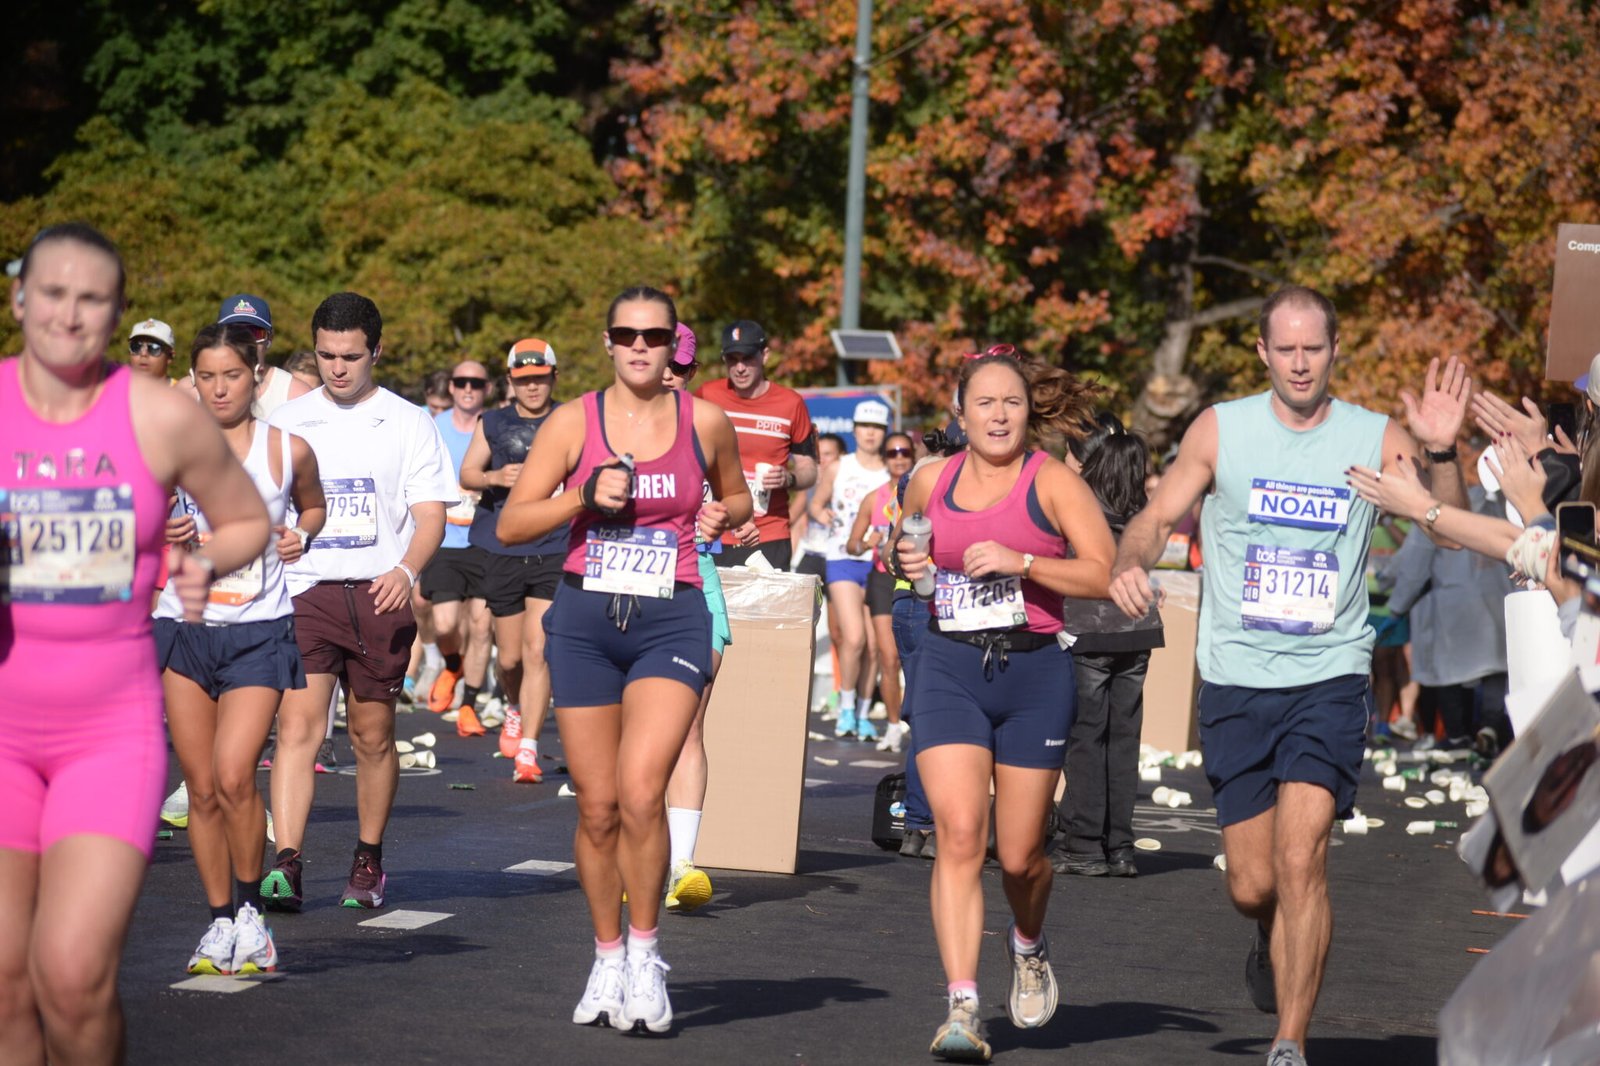
Two weeks ago, over sixty thousand runners hit the streets of New York for the largest marathon in the world. That means it’s time to dig into the data and see what kinds of stories it tells, albeit a little later than usual.
Regular readers know that I usually do this kind of deep dive in the days following every one of the Abbott World Marathon Majors, along with a handful of other large races. But for the past couple of months, I’ve been occupied with another project: running for Mayor in my hometown of West Orange.
Campaigning is exhausting, and during the peak of campaign season I simply didn’t have the time to devote to my usual writing projects. But Election Day is now behind us. I didn’t win, but the good news is that I now have much more free time. I’ve been catching up on some data collection and I plan to get back on track with a regular schedule of writing.
Starting with a deep dive on the New York City Marathon. As I got to work analyzing the data, the number of visuals quickly piled up. So I decided to break this down into two parts.
Today, we’ll focus on how the make up of the field is changing. Next time, we’ll dig in to data on finish times and splits. The main takeaway here: as the New York City Marathon reclaims its title as the world’s largest marathon, it’s runners are trending younger, there are more women, and there are fewer international runners.
Let’s get to it.
The Growth of the World’s Largest Marathon
The New York City Marathon was integral in the transformation of the marathon from a small competition to a mass participation event.
Fifty years ago, the 1976 race moved on to the modern five boroughs course. With 1,500 finishers, it leap frogged Boston for the largest race in America. The only comparable international race was the Schwarzwald Marathon in Germany. The next year, New York doubled in size, leaving Boston, Schwarzwald, and the new Chicago Marathon in the dust. For most of the following decades, it has reigned supreme as the world’s largest marathon.
The visual above tracks the number of finishers at New York, London, and Chicago over the past thirty years. In the late 90’s, things were closer. Throughout the 2000’s, New York grew to another level. But since COVID, that gap has closed.
For the last couple of years, London and New York have gone back and forth for the title. In April, London had 59,870 finishers. New York just notched 61,054 to once again assert its dominance.
The Make Up of the Field
As the field has grown, it has also changed.
First up: how has the balance between men and women changed?
Note that there is no data for the years the race was canceled: 2012 (Hurricane Sandy) and 2020 (COVID).
The visual above shows the gender breakdown of the field, going back to 2000. At that point, the field was still overwhelmingly (71.6%) male. Since then, there has been a steady trend towards greater parity between men and women.
This year, 47.5% of the finishers were women. That’s the highest it has been in the history of the race. It’s also much higher than the other Majors, with the exception of Chicago.
Next, are there shifts among age groups?
The visual above breaks the field down into four larger age buckets. The youngest group (under 30) roughly aligns with the split between Gen Z and Millennials, and this age group has seen a particular surge in marathon participation post-COVID.
Since 2000, the race has roughly doubled in size. Early on, that growth was focused among runners in their 30’s and 40’s. The older masters groups (50-69) also saw a huge surge, although there relative share remained small.
Throughout the 2010’s, the growth and changes were more muted. But after the race returned from COVID, things were different.
The 2019 race remained the largest in history until 2024. But when the race reached that size again, there were significantly more runners in their 20’s. That number continued to grow in 2025 and 2026. This year, there were 16,850 runners in their 20’s – about twice the number in 2019.
For a deeper dive on the changing demographics, take a look at this analysis. Note that I wrote it a little over two years ago, so there’s much less focus on the post-COVID period.
Digging Into the Age Distribution
Let’s dig into the age distribution a little bit more.
This graph drills down on more precise age groups over the past three years. This year saw a significant bump in the share of runners in the 20-24 and 25-29 age groups. There were also slight increases in the 30-34 age group. Most of the older age groups showed a corresponding decline.
This graph also shows a gender difference between the finishers. Although both groups are moving in the same direction, women trend younger than men. This year, an outright majority of women were under 35. There’s also a marked difference once women reach 35, a topic that’s worth exploring more deeply in the future.
This visual provides a more clear picture of how age intersects with gender. At a high level, the race is roughly balanced between men and women. Within age groups, it’s not.
Among runners in their 20’s – that quickly growing demographic – about 60% of finishers are women. Among runners from their late 30’s through their late 50’s, there’s a fairly stable split that leans towards men. And among the older masters age groups (60+) things shift towards being much more male dominated. Over two thirds of finishers in their 70’s and above are men.
Where Are the Runners From?
New York is a major international race. So another interesting question to explore is where the runners are from – and has that been changing?
This year, as well as back in 2000, the top five countries were the United States, Germany, France, Great Britain, and Italy. The visual below shows the raw total number of finishers from each of those countries, with everyone else combined into an “Other” category.
Note: 2025 and 2026 utilize the runner’s country of residence. I don’t remember if the historical data I gathered for previous races used this or their country of citizenship. So there may be some mixed methodology here generating small discrepancies. I think 2024 used residence and earlier years used citizenship.
From 2013 to 2019, the number of American runners was fairly stable: around 30,000. As the race continued to grow, it brought in slightly more international runners from around the world.
But in the last few years, that has changed. This year, there were 45,000 American runners. This was a large (5,000) bump over last year. Meanwhile, the number of runners from other countries has been shrinking.
This visual normalizes the data to put that in better perspective. Back in the 1980’s, virtually every runner was American. That declined sharply through the 1980’s and started to level out in the 1990’s. The share of American runners in the race reached a nadir in 2008 with just over 40% of finishers.
There’s an obvious outlier here: 2021. The first year after COVID, international travel was still depressed and 80% of the smaller field were American. But otherwise, this year had the highest share of American runners in a long time.
This year, 75% of finishers were American. It hasn’t been that high since 1982. If you instead used the country of citizenship, that number drops to 65% – and that’s the highest since 1986.
This aligns with anecdotal experience that the number of local runners earning their way into the race through 9+1 has been on the rise. Now that NYRR has changed the rules on that pathway and effectively capped the potential number of entrants, I wonder if this shift will flatten out or reverse itself in the next few years.
How Do American and International Runners Differ?
For one final question, let’s consider how those two groups of runners – American and foreign – differ. In previous analyses, I’ve found that international runners at American races tend to lean more towards men and tend to be older. Is that true here, and has it changed at all?
This first visual breaks runners into four groups by their gender and where they are from. The counts are then plotted by the larger age bins that we used earlier.
Among both American men and women, the number of runners in their 20’s, 30’s, and 40’s is on the rise. For the older runners, there’s little difference among American men – but women continued to increase year over year. On the international side, each group shrank compared to the previous two years.
You can also see that the gender ratio is different. The overall number of men and women on the American side is relatively similar. But among international runners, there are significantly more men.
This final visual norms that data and shows the gender distribution of each age group among American and international runners.
The general trend holds across each group. Among younger runners, there are relatively more women and among older runners there are relatively more men. But there’s also a general shift. Most age groups see a shift of 10 to 20 percentage points towards women on the American side.
So How Is the NYC Marathon Changing?
Once again, the New York City Marathon is the largest race in the world. It rose above 60,000 finishers for the first time and reclaimed its title from London.
One trend found in other races – a huge increase in participation among younger runners – holds true here. Year over year, there have been more finishers in their 20’s. It’s now twice what it was in 2019.
But in another respect, New York is unlike other large races. In many other races, that growth has leaned towards young men. At New York, however, the growth was greatest among young women. An outright majority – ~60% – of runners in their 20’s are women.
That tracks with previous analyses I’ve done of New York, so it doesn’t surprise me. But one thing that did surprise me was the shift among international runners. At other Majors, that number is on the rise. But at New York, the number of international runners is at a low point and trending lower.
Maybe that will change next year with the new format for 9+1. We’ll see.
Check back later this week for part 2 of this analysis, where we dig in to some data on finish times and splits. If you haven’t already, use the form to subscribe to my newsletter and make sure you get it in your inbox.