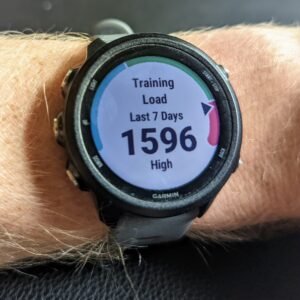
There are a number of advanced metrics available on your Garmin watch. One of these is Garmin training load.
Ever wonder what it is and how it’s calculated?
Keep reading, and I’ll give you a quick rundown on what the training load metric is, how its calculated, some potential problems with the data, and how it can inform your training.
What Is Garmin Training Load?

As a runner, you probably track some stats to keep an eye on how hard you’re working.
A simple one is mileage. Most runners have a log of how many miles they’ve run, and they think about this in the context of miles per week. Getting fitter requires you to push the limits of what you’re used to – but if you push them too far, you risk overtraining or injuries.
If you’re used to running 25 miles per week, then 20-30 miles per week is probably good. But if you suddenly jump to 50 miles per week, you might have a problem. Conversely, if you back off to 10 miles per week, you can’t expect to make much progress.
While this is useful, the problem with mileage is that it doesn’t take into account intensity. 3 miles of intense intervals puts a lot more strain on your body than a leisurely 3 mile jog over some trails. It also doesn’t take into account exercise spent doing something other than running – like perhaps biking or swimming.
Garmin training load is a way to account for these things and combine all of your efforts into a single number. This number represents the total amount of “work” you’ve put in over the last 7 days.
How is This Training Load Calculated?
Garmin has developed an algorithm that combines a few data points to calculate your training load.
In terms of data collected, Garmin is looking at your heart rate throughout an activity, the duration of the activity, and your heart rate variability. Collectively, these are used to estimate your EPOC or excess post-exercise oxygen consumption.
When you’re exercising, your heart rate is elevated because your body is using extra oxygen and trying to pump it around to your muscles. Similarly, when you’re done exercising, your heart rate will remain elevated for a while. While you may have cooled down and appear to be at rest, your body is still busy pumping additional oxygen around to promote recovery and return things back to normal.
EPOC is an estimate of how much extra oxygen is used following exercise. The more intense and longer the activity, the higher this EPOC will be. The less intense and shorter an activity, the lower this EPOC will be.
This impacts a few other statistics your Garmin provides – including training effect, training status, and recovery.
In terms of training load, the total EPOC for the last seven days is added together. This sum is the number reported on your watch.
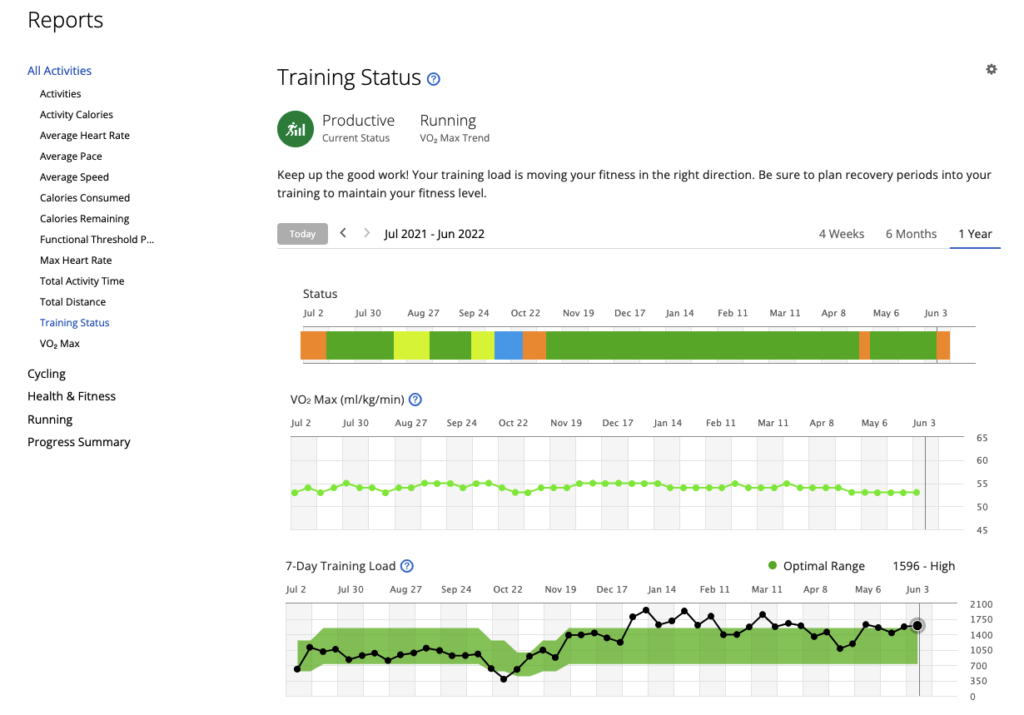
Garmin also calculates an “optimal” range for this training load. On the graphs, it will show you the optimal range and where your current training load fits in. This optimal range is calculated based on your training load history as well as your current VO2 max estimate.
Where Can I Find Training Load?
You can find training load in three places.
First, it is available as a screen on your Garmin watch. When I scroll down, I see a screen with Training Status on it. After I press the “Start” button, my VO2 max appears. When I scroll down one screen from there, I see my training load.
You an also find training load on the Garmin Connect App on your phone. When I open the app, there’s a tile towards the top of the screen labeled “Training Status.” It includes my current training status, my estimated VO2 max, and my training load. If I click on that and then click again on “7-Day Training Load,” I can see a chart with historical training load data for the past four weeks.
Finally, you can find the same information on the Garmin Connect website. Once you log in, click on “Reports” in the menu. Towards the bottom of the list, click on “Training Status.” This will bring up a page showing your training status, VO2 max, and training load. In this mode, you’re able to look back over 4 weeks, 6 months, or a year.

What Are Some Potential Problems with Training Load?
As with all things Garmin, this is a potentially useful metric. But it is an algorithm that is based on estimates and available data.
So it’s not perfect! Here are a few potential issues to keep in mind.
First, the algorithm is only as good as the data that it receives. The most important piece of data is your heart rate throughout an activity.
If you’re relying on your optical heart rate monitor on your watch, you might have issues with cadence lock. This will severely impact any estimate of your training load. It’s a good reason to wear a heart rate strap, like the HRM Dual, if you plan to take this information seriously.
Second, there are plenty of other things that may impact your heart rate. Weather, illness, an excessive amount of hills. If any of these things artificially increase your heart rate during an activity, it may lead Garmin to overestimate your training load.
Third, training load is strictly calculated on a 7 day basis. If your schedule is rigid, this isn’t a problem. For example, a schedule with a long run on Sunday, an interval workout on Wednesday, and a tempo run on Friday will be fairly consistent in terms of training load.
But if you move any of these dates, it will cause a short term spike in your training load. Let’s say you have to move your Sunday long run to Saturday. That week, you’ll have two long runs (the previous Sunday and the current Saturday) included in the calculations. Things eventually smooth back out, but just know that the spike is temporary.
Another thing to keep in mind is that Garmin training load is only a measure of the physiological stress you put on your body. It doesn’t necessarily estimate the physical stress you put on your body. These things are similar. But if you drastically increased your mileage, while maintaining very low intensity, you might be able to maintain a reasonable training load – even though the physical stress on your body is great.
Finally, the optimal training load is dependent in part on your VO2 max estimate. Since your VO2 max estimate isn’t perfect, you should also take this with a grain of salt.
How Garmin Training Load Can Inform Your Training
Your Garmin watch is essentially telling you two things through the training load feature. This is how much effort you’ve put in over the past seven days, and that is either higher, lower, or right where it should be.
I wouldn’t pay too much attention to this feature day to day, given the fluctuations that can happen due to your schedule. But it is a good idea to look at your training load and look for patterns.
If you’re starting to train harder – maybe because you’re beginning a new training block – you should see a sustained increase in your overall training load. Or, if you’re going through a recovery period, you should see a decrease. When I look at my graph above, I see both of these trends clearly.
If you’re increasing your training, then it may be a good idea to keep an eye on your training load to make sure you’re not increasing it too much. While I wouldn’t necessarily worry about staying exactly in the green optimal zone, I would make sure that you’re giving yourself time to adjust to any new level of training.
The first summer I had my Garmin, I was around 6-800 per week. The next summer, when I started training for a marathon, this increased to 800 to 1,000. This spring, my intense 5k-10k training saw this spike to 1,500 to 2,000. And I’m sure that my next marathon block will also be on the high end.
How useful have you found Garmin training load to be? And what’s your average training load? I’d be curious to hear about it in the comments.
Note: Training load is available on many Garmin watches, but not all. Check out this comparison of Garmin Forerunners to see which ones include this feature, and which one is right for you.

Newer watches (my Forerunner 955 at least) seem to use a weighted average based on 10 days load to give the Acute Training Load instead of the old flat sum of 7 last days load so the effect of moving a session up or down a day is less. There’s no longer a sharp drop off when the load from a big session or race from a week ago falls off the calculations.
Details : today’s activity load gets weight of 10, yesterdays’ get weight of 9, down to 1 for 10 days ago. The total is then scaled to give a weekly value for reporting/comparison. I haven’t been able to work out the details of the “optimal range” green bar yet, but it may be something similar based on previous load values but weighted over a much longer period.