Recently, Garmin introduced a new feature in their latest watches – Garmin HRV Status.
This metrics tracks your heart rate variability, compares it to historical data, and gives you some insights into whether or not your body is balanced and recovering well. In the Forerunner line, this feature launched with the Garmin Forerunner 255. In the Fenix line, it’s available on the Fenix 6 and later.
So what is heart rate variability, and what does Garmin HRV status actually mean? Let me break it down for you.
What Is Heart Rate Variability
First, let’s start with a little physiology.
You’re familiar with the idea of a heart rate. This is how many times your heart beats per minute. It’s one of the many things your Garmin watch can track for you.
Heart rate variability is a related metric. But instead of counting how many times your heart beats in a certain time period, heart rate variability tracks the amount of time between those heart beats – and how much that varies. It’s tracked in milliseconds.
If the time between your heart beats is consistent, that means your heart rate variability is low. On the other hand, if the amount of time between each beat is a little bit different each time, this means your heart rate variability is high.
As a general rule, when your heart rate is lower and when your body is comfortable, your heart rate variability should be high. When your pulse quickens – because you’re exercising, you’re sick, or you’re stressed – that variability will be reduced.
You can read more about heart rate variability here, but this is the short version: high heart rate variability tends to mean that a body is in balance while low heart rate variability can be a sign that something is out of balance.
How Does Garmin Measure Heart Rate Variability?
Your Garmin watch measures your heart rate, and it also measures your heart rate variability. You can see this data represented in a number of ways. These measurements will always be based on when you are asleep.
You can find these graphs on your watch as well as on Garmin Connect. If you go to “Daily Summary” in the Garmin Connect menu, you’ll see HRV status near the top. There’s also a report option that shows you some historical data.
Are Garmin HRV Readings Accurate?
It’s normal to be skeptical of these gadgets. So is there any evidence of Garmin HRV accuracy?
In March, a group of researchers published an article in the European Heart Journal. They compared readings from a Garmin Vivoactive 4 with those from an electrocardiogram.
Their findings: Smartwatch-derived HRV provides a practical alternative with excellent accuracy compared with ECG-based HRV for global markers and those characterizing lower frequency components. However, caution is warranted with HRV markers that predominantly assess short-term variability.
In other words, the watches do a good job of tracking trends and looking at the big picture. But they are less reliable when it comes to providing instantaneous readings.
This jives with Garmin’s approach to HRV status – which is to focus on longer, overnight readings and long term averages instead of instantaneous readings. So it is accurate and useful for the purpose to which Garmin has applied it.
The Four Views Into Garmin HRV Status
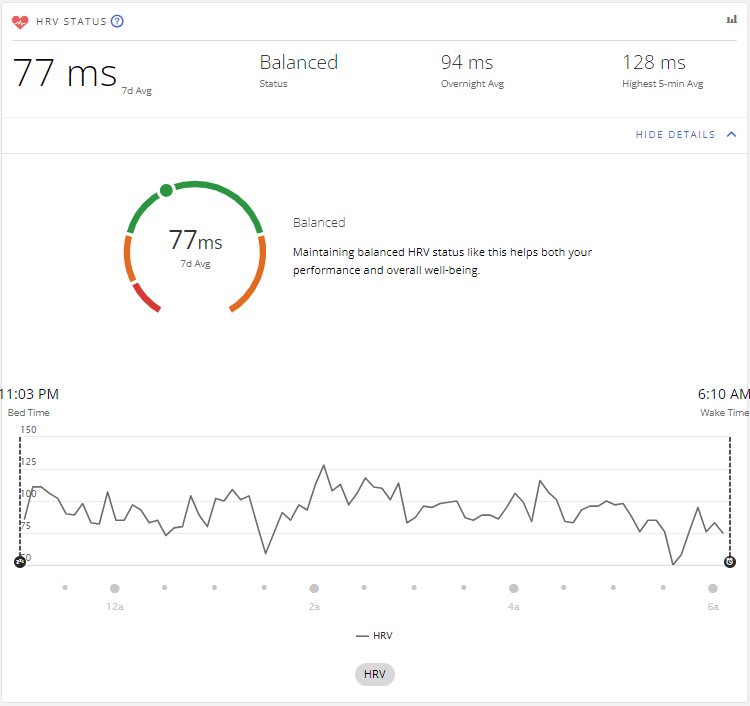
First, you can see a graph of your heart rate variability from the previous night. This graph will show you instantaneous readings of heart rate variability, taken throughout the night. You should see the value go up and down, and you should expect a lot of noise. At the top of the screen, you’ll see a single value for your average heart rate variability for that night.
Second, you can see a graph of your heart rate variability over the last seven days. On this graph, your Garmin will plot your average HRV for each night over the last week. There will be a single number at the top – the average – and you’ll see that number plotted as a horizontal line across the graph.
Third, you can see a graph of your 7-day average heart rate variability over the last 4 weeks. This graph should look more smooth than the others, because it isn’t plotting single overnight values. It’s taking those 7 day averages, from each day, and plotting them. You’ll also see a green band in the middle of the graph, which represents your “normal” or baseline level.
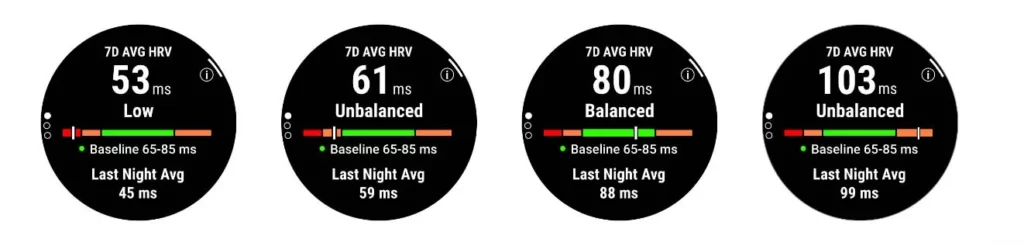
Finally, there’s a screen that summarizes your heart rate variability with a heart rate variability status. It will show you your current 7-day average, your heart rate variability from the previous night, what your baseline values are, and where your 7-day average sits relative to your baseline.
What Is HRV Status On Garmin?
As a single summary, the one thing you should look at is your heart rate variability status. This will give you an idea of what your heart rate variability is in the context of where it should be.
This value can be one of four things – Balanced, Unbalanced, Low, or Poor.
When you see that your Garmin HRV status is “Balanced,” everything is normal. This means that your 7-day average falls within your own baseline range, and that baseline is within a normal range. Over time, your Garmin will adjust this baseline as it continues to collect more data.
If your status is “Unbalanced,” this means that it is slightly outside the range of your baseline. It could be higher or lower. Either one is a sign that something may be wrong. Although higher heart rate variabilities tend to be better, an abnormally high HRV value can be a sign of overtraining. If it’s too low, this can be a sign of under-recovery, illness, or some other form of stress.
If your status is “Low,” then it is much lower than your personal baseline. When you get to this level and stay there, it is a sign that something is wrong. It could be a temporary thing – like an illness – or it could be a sign that you need to focus more on recovery and sleep.
Finally, if your status is “Poor,” that means that your baseline itself is lower than it should be. As a general rule, heart rate variability baselines vary from person to person, and there’s no “perfect” target. But there are general ranges that indicate good health, and if your baseline is far below that range it’s a sign that something is far out of whack.
What Is a Good HRV Status On Garmin?
Your actual heart rate variability – measured in milliseconds – is going to vary from person to person. Like maximum heart rate and resting heart rate, this is in some ways unique to each individual.
This is why Garmin puts more focus on your HRV status than your overnight heart rate variability reading. The status takes into account your own personal history to determine whether things are in or out of balance.
A good HRV status on Garmin is labeled ‘Balanced.’ You get this status when your 7 day average is in the green zone – which represents your own baseline. This baseline is determined by looking back over a longer period to see what your ‘normal’ is.
If your heart rate variability is consistently higher or lower than that baseline, something is out of whack – and that’s not good.
What Does Low HRV Mean On Your Garmin?
If your Garmin HRV status says ‘Low,’ it’s a sign of a potential problem.
This means that your average heart rate variability over the last seven days is below your own baseline. It isn’t just a single day that was low – it’s a consistent measurement over the previous week.
This isn’t necessarily problematic. Perhaps you’re in the middle of a stressful week where you’re working too much, not sleeping enough, or generally treating your body like trash. If you know this, and it’s a short term situation, your HRV status should recover quickly.
For example, I recently attended a wedding at an all inclusive resort in Jamaica. We stayed up late, we partied, and I drank more than usual. I wasn’t surprised to wake up after a few days and see that my HRV status was low. I made sure to take things easy with my running, and when I got home and dried out everything returned to normal.
You should be concerned, though, if there’s no immediate cause and if it doesn’t correct itself. A consistent low HRV status may be a sign of overtraining – in which case you should take things easy – or it could be a sign of an illness – in which case you may want to see a doctor.
How Is Heart Rate Variability Different From Stress and Body Battery?
Even before Garmin HRV status was a thing, Garmin watches tracked heart rate variability and used it to inform other metrics.
In particular, the stress score on your Garmin watch is informed by short term measurements of heart rate variability. This, in term, influences whether you’re Body Battery goes up or down at any given moment. You can read more about Garmin Body Battery here.
The difference here is that your stress score is focused on a moment in time – is your heart rate variability depressed in this moment? Heart rate variability status, on the other hand, looks at long term trends.
It’s perfectly normal for your heart rate variability to drop and your stress to increase in the hours following a workout. And the lingering effects of a hard effort (or a hard night drinking) may be reflected in your Body Battery the following day. But even a hard race like a marathon shouldn’t be enough, by itself, to knock your Garmin HRV status out of whack.
What Does HRV Status Look Like in Practice?
As an example, here’s a snapshot of my own heart rate variability status over the past 4 weeks (taken from the report in Garmin Connect).
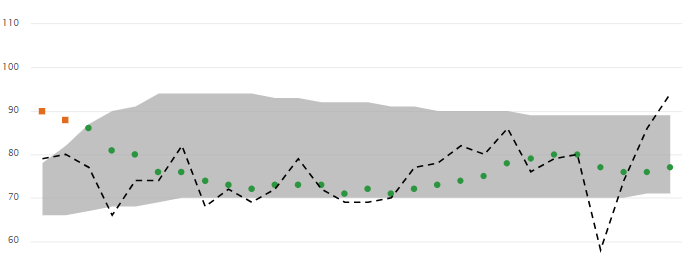
The gray area in the middle is the baseline zone. This is my second month wearing the watch, and it takes a few weeks for it to establish your initial baseline. Notice that in the early part of the period, the baseline is much thinner and lower. Over time, it got more accurate.
The dotted gray line is the overnight heart rate variability status values. Notice that they go up and down, and there’s quite a bit of daily variation. My values were a bit higher at the beginning of the period (going into the previous week) because I was just coming back from vacation. You can then kind of track when I got back into heavy training, and the values drop a little bit (but not too low). In the later portion, the values go up in the week leading up to the race – evidence of a taper and better rest.
The night in which it drops really low – 59 – was the night after my marathon. But it starts to bounce back the very next day.
The green dots represent the 7-day average and the status. Throughout most of this period, it’s balanced. Even in the days following my marathon, the green line is relatively stable. It was unbalanced for a few days at the beginning, but this was probably because the watch was still learning the appropriate baseline.
So Is HRV Status a Useful Metric?
Stress and Body Battery are two of my favorite metrics on my Garmin, because they help me gauge how recovered I am. I’ve come to see HRV Status as another useful metric in the same vein – and I really like how it’s just a quick snapshot.
The overnight HRV value can be similar to Body Battery. But the real value in HRV Status is looking at the 7-day average to smooth out daily variations and to then evaluate that against your own baseline. It won’t bounce around a lot, and you won’t necessarily see the fatigue from a hard session or a race. But if you notice that 7-day average getting out of whack, it’s a sign that something is very wrong.
That being said, your mileage may vary. Some people don’t get reliable readings from their Body Battery and stress scores, and I’m sure some people will have trouble getting reliable HRV status readings as well. It’s worked very well for me, and I’m happy with it – but that may not be your experience.
Speaking of which, I’d love to hear your experience with heart rate variability on you Garmin. Leave a comment below, and let us know how it works for you!
I experienced a balanced HRV when training hard and a Low HRV even down to Poor when I rested and Tapered for three weeks (after 16 weeks blocks).
Then post Marathon race it remained Low until I started training again…and when I got into full training mode 3-4 weeks out from the race it was perfectly balanced again.
I don’t understand this. I do feel better when training than when recovering, that’s normal after months of work. But HRV didn’t come back to balanced UNTIL it got under stress again. Maybe that’s a personal thing too.
That is strange. There is an element of personal variation, so there is that possibility.
There was also a software update a month or two back that dropped everyone’s scores. It’s possible this lined up with when you’re score went down, and then over time this became your new baseline – leading to it being balanced again.
My HRV is running at 32 and it tells me that it is balanced. But looking at the examples above I am way under what seems to be normal?
That is quite a bit lower than me. However, baseline levels can vary a lot from individual to individual. For example, it’s typical for HRV to go down as people age and be much lower in your 50’s and 60’s than your 30’s and 40’s.
The number itself usually isn’t something to worry about – it’s the long term trend that you should pay attention to. If that’s your baseline number, and it stays there, then you’re good to go.
Our tests of the measurement of HRV using wearables has found that the results cannot be relied on. The research that you quote appears to contradict that, until you look more closely at the paper’s findings. The PPG based devices have a correlation of 99% when measuring pulse rate, but only 69% when measuring RMSSD.
At HRV Health we rely exclusively on the Polar H10 heart rate monitor. It is the gold standard among commercially available HRV measurement devices. Even the Polar has problems, with readingls becoming unreliable when the battery level is low, or when there are problems with the strap.
Using wearables in an uncotrolled environment produces results that are virtually useless. Proper HRV readings should be taken while the subject is completely relaxed, as close as possible to resting heart rate. HRV metrics produced in day to day living are completely unreliable as this introduces too many variables to allow any meaningful analysis.
HRV is a remarkable science, and when properly implemented can provide profound insights into health and fitness. Unfortunately, the wearable companies are undermining people’s faith in the technology because they are promoting usage that does not match the best practices required to produce meaningful data. That is a shame.
Hi!
Even though my HRV status has been ”Low” for the last few days, thus suggesting rest, my Garmin 265 still suggests tough training as a daily suggestion for the half marathon I am training for. Isn’t that contradicting?
I’m a cyclist with a recent baseline of 32 to 43 HRV – quite low? I cycle around 800km per month and mainly, I’m an endurance cyclist as opposed to a racer.
I wanted to say what great information to get the best out of the Garmin watch and app. I’d got some help from emailing Garmin support and some of it led to confusion. I was told not to wear my watch when I use my Garmin Edge bike computer but on Garmin website, it says to wear it if you have a computer that doesn’t have body battery (BB) facility – it’s an Edge Explore and it doesn’t have that facility.
The stress section was getting me confused – surely you need to wear the watch to record the stress body is under although my Edge has HR analysis through the dual HRM I use.
The HRV is the next thing I’m looking at as I’ve worn the watch for sufficient length of time now.
I used to have a Forerunner 11 years ago and used to endurance run cross country but those days are long behind me and cycling is what I do. I went over to Apple sports watch but I’m back to Garmin as a fitness watch and I chose Lily Active as I like my Edge for my dashboard and cadence but I suppose I can just run the Edge but use the watch to record the activity as I’ve paired the HRM to it and I get other metrics like training load so I’ll pair cadence to it as well.
What I’d like is to run both and then delete one off Connect – it’s just as a back up really.
I’d welcome any suggestions.
I’ve shared links to your website due to the very good explanations you’ve given on the HRV and BB sections.