
When Garmin released the Fenix 7 Pro, it had a (somewhat) exciting announcement – the watch would include wrist based running dynamics.
Previously, you could get some data by using only your watch. But to get the full suite of running dynamics data, you needed to pair with another device like a running dynamics pod. They now promised to deliver the same data without the use of the pod.
Later, these features were also rolled out through an update to select older models – like the Garmin Forerunner 965 and 955, and the Forerunner 265 and 255. See the Garmin Support page for a full list of watches that with this feature.
So what exactly are these Garmin wrist based running dynamics? And what can the data tell you? Let’s take a quick look.
Defining What Running Dynamics Are
Before we look at some example graphs with data, let’s just quickly define what running dynamics are.
When you log on to Garmin Connect and look at an activity, there is a section titled “Running Dynamics” when you scroll down to the “Stats” portion of the activity page. Based only on recording an activity with my Garmin Fenix 7S Pro, here are the stats that I see listed there:
- Average Run Cadence
- Max Run Cadence
- Average Stride Length
- Average Vertical Ratio
- Average Vertical Oscillation
- Average Ground Contact Time
Cadence and Stride Length
The first three stats relate to stride length and cadence. These are directly related.
Your cadence is the number of steps you take per minute, and your stride length is the length of each stride (measured in meters). At the same pace, if you increase your cadence you’ll decrease your stride. If you decrease your cadence, you’ll increase your stride. When you speed up, you typically either a) increase your cadence, b) lengthen your stride, or c) some combination of (a) and (b).
Note that these three running dynamic stats are available with older watches. I used to see them on activities tracked with my Garmin Forerunner 245.
The other three, however, are new. And these are the new wrist based running dynamics that used to require a separate pod attached to your shoe.
Vertical Oscillation and Vertical Ratio
Vertical oscillation is a measurement of how much your torso moves up and down with each stride. It’s essentially a measurement of how bouncy you are. Generally speaking, you want to be less bouncy – and move forward without going up and down. This should, in theory, be more efficient.
Vertical oscillation is measured in centimeters. When you view it on a graph, it’s color coded to show you how “good” or “bad” your vertical movement is – with purple being the least vertical oscillation and red being the most.
Vertical ratio takes this vertical oscillation and compares it to your stride length. It’s computed by dividing the vertical oscillation by the stride length, and it’s represented as a percent. Again, lower numbers tend to be preferable than higher numbers – indicating a more economical and efficient stride.
The reason you’d want to look at vertical ratio instead of just vertical oscillation is that when you speed up, you naturally tend to increase your vertical movement. But as long as your stride lengthens enough to compensate, you’re not wasting any energy.
The summary stats at the bottom of the page show you an average, but you can see a graph with these stats plotted over the course of your run.
Ground Contact Time
Ground contact time is a measurement, in milliseconds, of how long your foot is in contact with the ground when you take a step. Lower ground contact times indicate a more efficient stride. Higher values are a sign you’re not running efficiently, and likely losing some energy and momentum with each step.
If your ground contact time is too high, it could be a sign that you’re overstriding. It could also be a sign that your fatigued, and you’re just plodding along. But your ultimate goal is to make each step quick, efficient, and light.
These values are color coded on the chart. In this case, the color coding refers to what percentage of runners have that ground contact time. So it’s a reference point allowing you to compare yourself against average or elite runners.
Remember: There’s No One Size Fits All Stride
It’s worth pointing out here that there is no “perfect” stride. There are some characteristics of a good stride that typically indicate that a runner is efficient and economical.
For example, most elite runners tend to have relatively high cadence, low vertical oscillation, and low ground contact time. But there are exceptions, and some people do develop strange looking forms. And sometimes, they work for them.
If you’re brand new to running, it may be worth paying attention to some of these things and trying to “perfect” your stride. But often you’re better off letting it develop naturally, rather than trying to force yourself to run one particular way.
Garmin Wrist Based Running Dynamics In Action
So what do these stats actually look like in action? And what, if anything, can they tell you?
I’ll show you examples from three different activities that I’ve done recently – a race, a workout, and an easy run.
You’ll quickly notice that the patterns in these graphs change a lot, depending on what kind of activity you’re looking at.
Wrist Based Running Dynamics During a Marathon
To start, let’s take a look at the running dynamics graphs from my most recent marathon – the Erie Marathon at Presque Isle. You can read my race report if you want more details, but I’ll summarize a few things below as I describe the graphs.
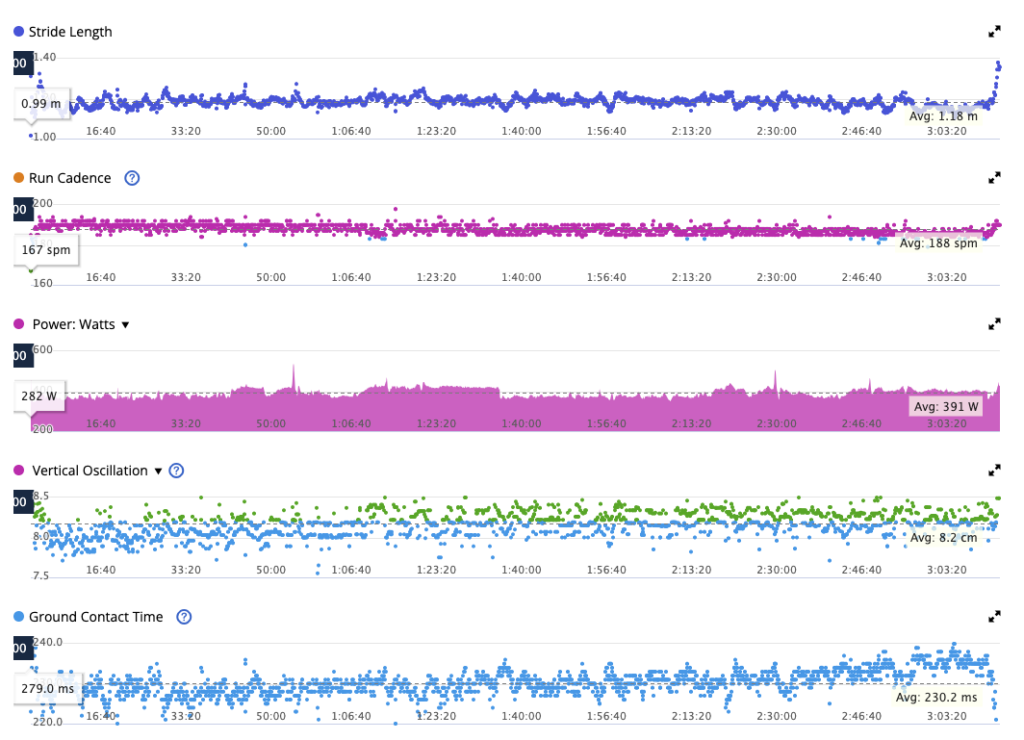
Before we get into the graph, here’s what you should know about how the race went. For the first twenty miles, it was great. I was consistently on pace (7:12/mi) with almost perfectly even splits. Over the last six miles, I slowed down slightly – first about 5 seconds per mile, but at the end by about 20-30 seconds per mile. And then I finished strong with a sprint in the last couple hundred meters.
My average stride length was 1.18m and you can see in the graph that it was pretty consistent throughout the race. Since there’s very little variation, the graph is zoomed in and you can see some noise. But until the sprint at the end, it’s more or less the same.
Cadence, too, is pretty consistent. My average cadence was 188spm with a max of 198spm. If you were to zoom in, you could see that my cadence does decrease ever so slightly around the 20 mile mark. In the first 20 miles, it was around 190 +/- 3spm, but towards the end it was closer to 185 +/- 3 spm. So it picked up on me slowing down a bit.
In the vertical oscillation graph, you can see a shift as the race goes on. For the first half, my vertical oscillation was somewhat lower. As I neared the halfway point, it had increased a little. You can see the dots go from mostly blue to a mix of green and blue. Again, this matches my experience of the race where things felt super smooth for the first half and got increasingly difficult in the second half.
Finally, you can also see a shift in ground contact time. Again, it’s pretty constant for the first half. It slowly starts to increase around the halfway point, and it’s significantly higher in the last few miles. This, too, matches with my experience in the race.
So did these stats tell me anything I didn’t no? Not really. They essentially confirmed my own subjective experience of the race. They are interesting, but there’s no actionable advice – other than “Don’t get tired.”
Wrist Based Running Dynamics During a Workout
This next set of graphs comes from a workout I performed a couple of weeks before the race. It was a long run – 16 miles – with three intervals of 10 minutes at threshold pace. I wrapped up with a few easy miles for a cooldown.
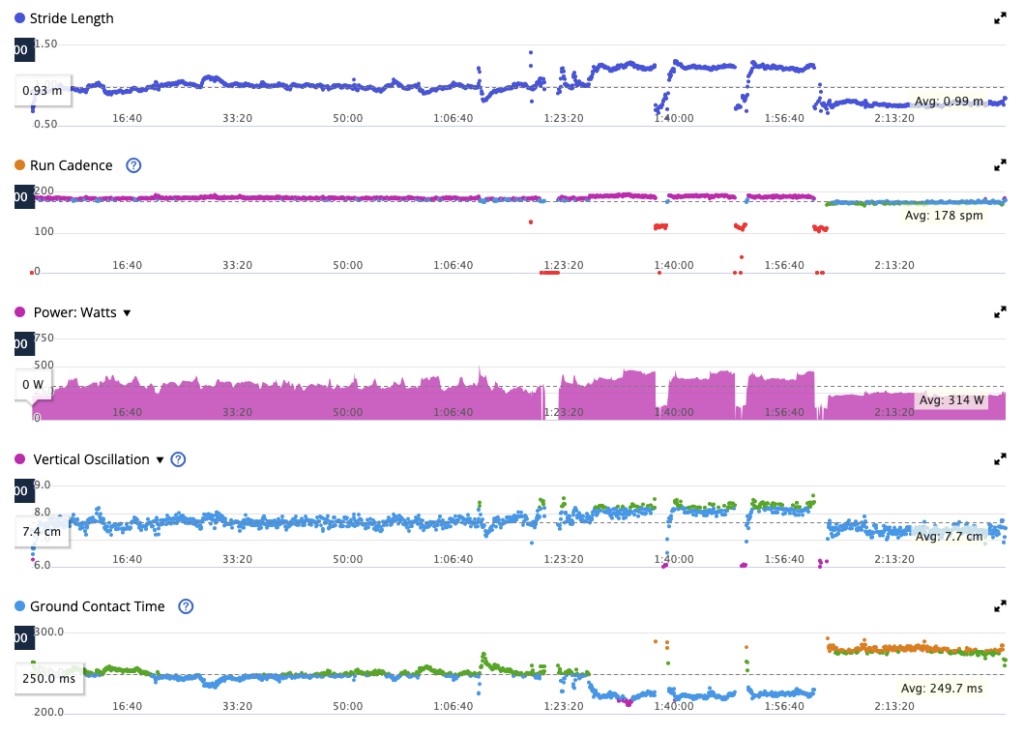
From the get go, this is a very different looking set of graphs. In the race, I ran pretty much the same intensity the entire time – so there wasn’t a lot of variation.
But here, you can clearly see where the different parts of the workout. The first hour is an easy run, then there are three ten minute intervals, three two minute recovery periods, and a short cooldown.
For the workout intervals, you can see that stride length increases, cadence increases, vertical oscillation increases, and ground contact time decreases. If I switched vertical oscillation to show vertical ratio (it’s a toggle and you can only view one), it would go down, due to the increased stride length.
You can also see during the cool down that I was moving slower, with a decreased stride length, an increased cadence, a decreased vertical oscillation, and an increased ground contact time.
Again, I’m not sure if there’s any actionable advice here. But it is interesting to see the workout clearly displayed on the graphs through these statistics. Without me describing the workout, you could just look at these graphs and have a general idea of what I had done.
Wrist Based Running Dynamics On an Easy Trail Run
Finally, here’s a graph from my easy trail run this morning. I ran six miles on my usual trail – which starts with a small hill and a single track trail before transitioning into a flatter, wider trail with rolling hills.
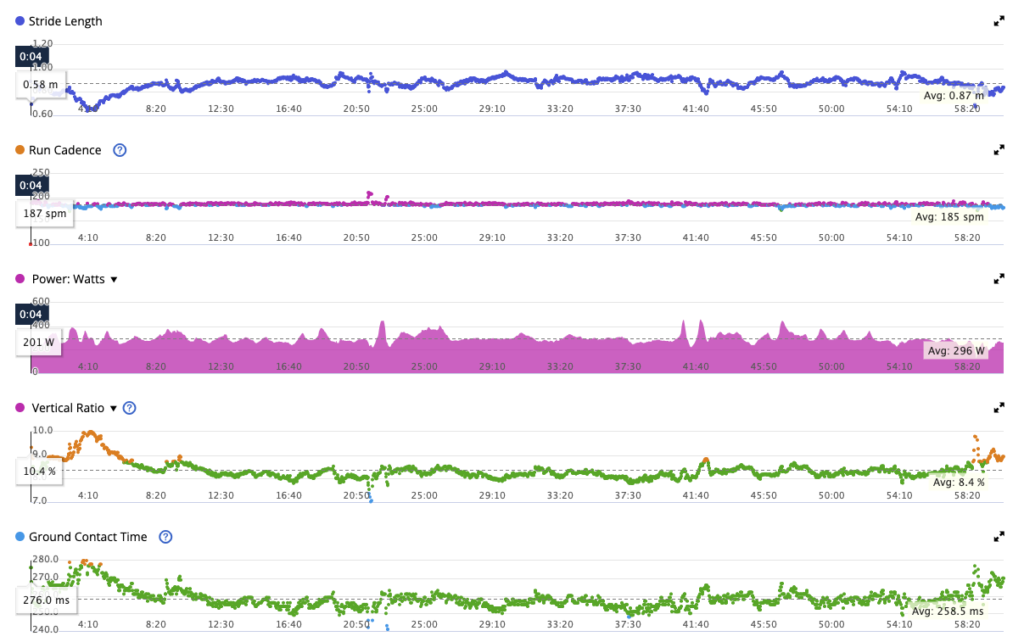
As with the race, my effort throughout this run was pretty much the same. So most of the graph is pretty uniform, with few big changes.
There is a surge in vertical ratio in the beginning, along with ground contact time. This lines up with the hill and single track trail I have to run up to get to the main trail. But once I’m on the main trail, it evens out pretty quickly.
Note that the average stride length (0.87m) and cadence (185spm) are slower when I was running at effort for the race. Likewise, the ground contact time (258.5ms) is higher than during the race. This is to be expected, though.
So Are Garmin Wrist Based Running Dynamics Useful?
Ultimately, that’s the million dollar question. Are Garmin wrist based running dynamics useful, and do they justify getting a more expensive, fancier watch?
This feature was rolled out to make the Fenix 7 Pro and the other new watches “better” than their predecessors. Even with the updates to older watches, these aren’t coming to the basic Garmin Forerunner 55https://amzn.to/45W4cGI. So just how useful these are may be an important question in justifying a more expensive watch over a less expensive one.
Personally, I don’t find them very useful. There are some features of my Garmin Fenix 7 Pro that I very much enjoy, and I would miss them if they disappeared tomorrow. The wrist based running dynamics just aren’t one of them.
They are interesting in the sense that the graphs can tell an interesting story. I like data, and I like seeing reality mapped out on a graph. But at the end of the day, I just don’t find that these data points give me any actionable advice that would help me make decisions about improving my running.
Is it nice to have? Sure. Could I live without it? Absolutely. Is this a reason to buy a more expensive watch? No.
There are, however, other features that do justify choosing one of the more expensive watches. For a run down on your options, check out one of these articles: